Breaking down the Design Brief
A.I
MES
Sensors
Cameras
Robotics

Identify
Dashboard
Analytics
Routemap
Preventive

Tasks
Value mapping
Poka yoke
TAKT time
Throughput time

Production
SMEs
LMEs
Batch,Line,Job

Customer related
Design
Computer vision
Data analysis
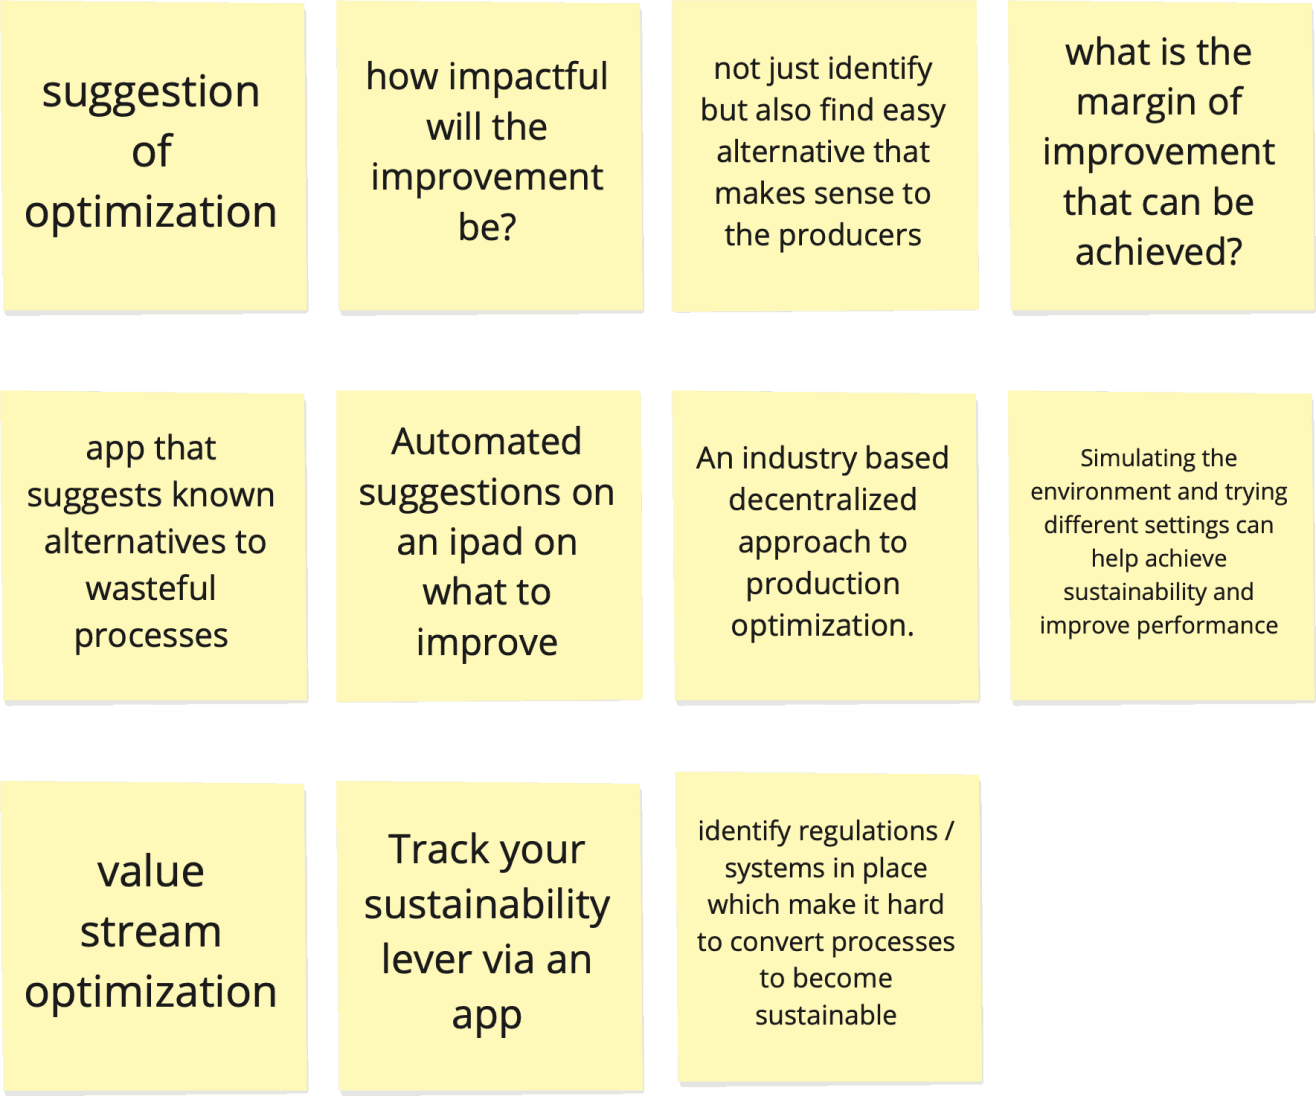
Production Sustainablity
Optimization
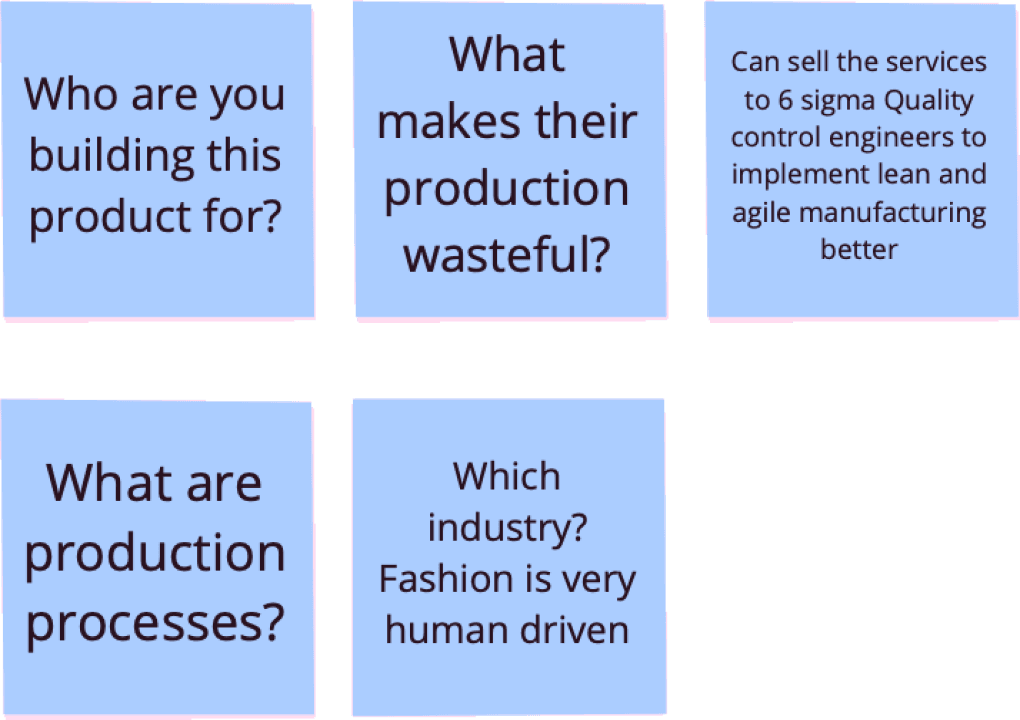
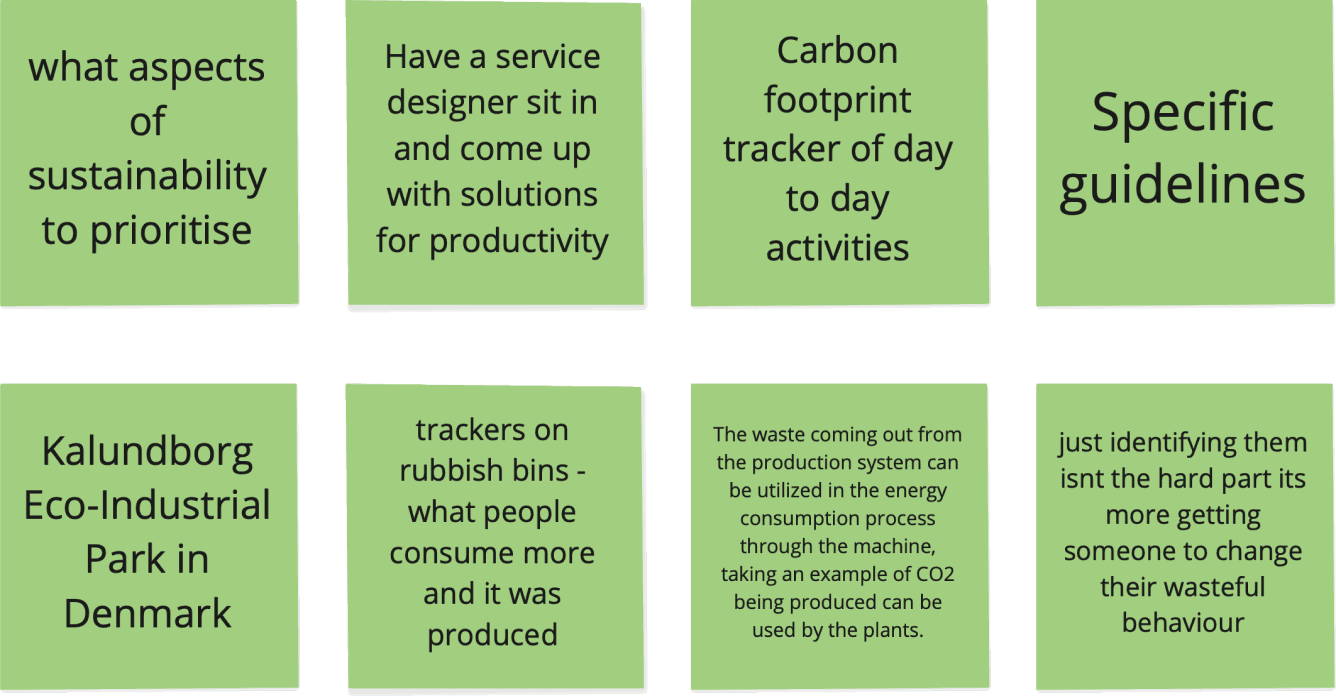
Speed storming
collaborating all thoughts within the organisation to find focus areas and creating clusters
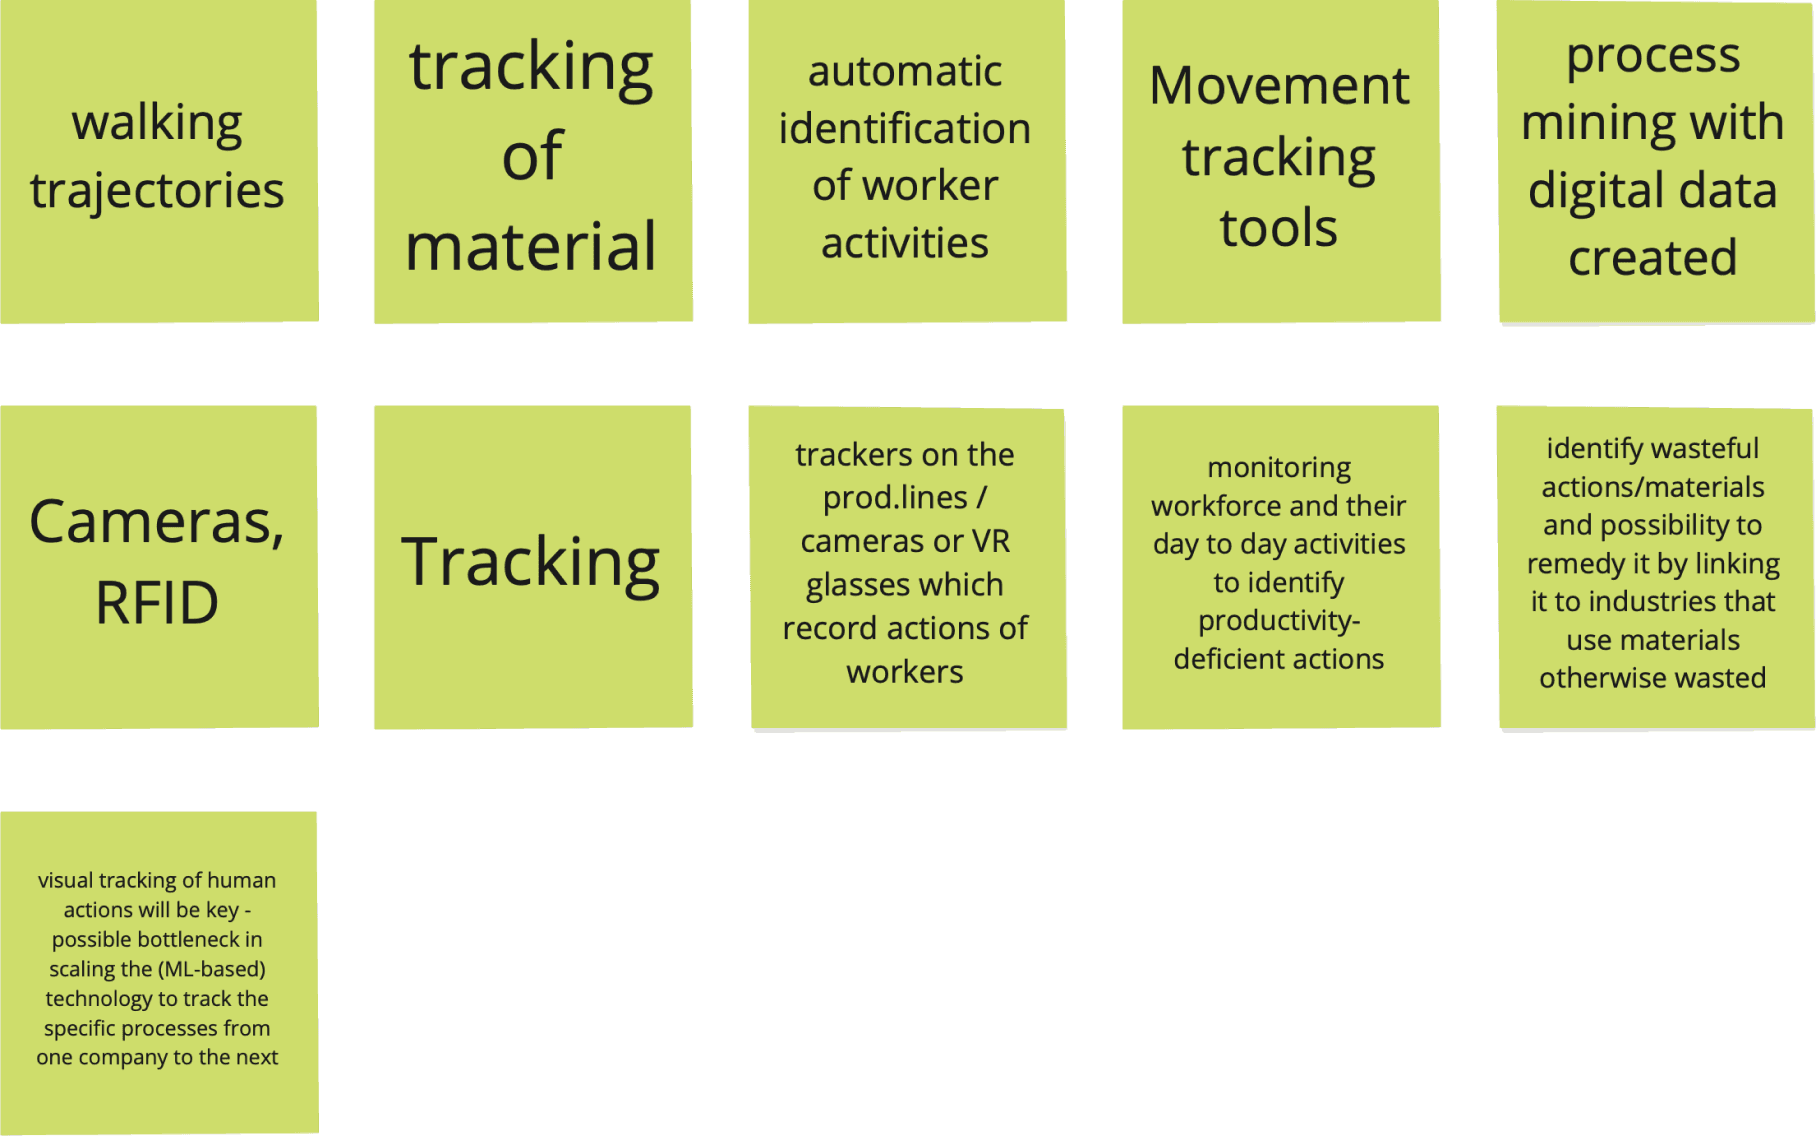
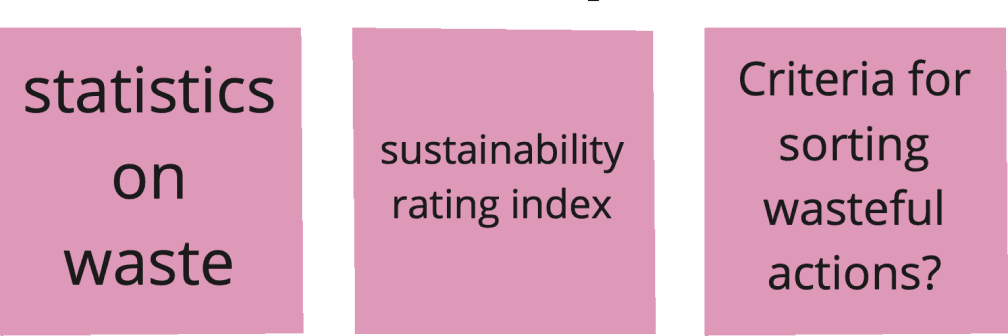
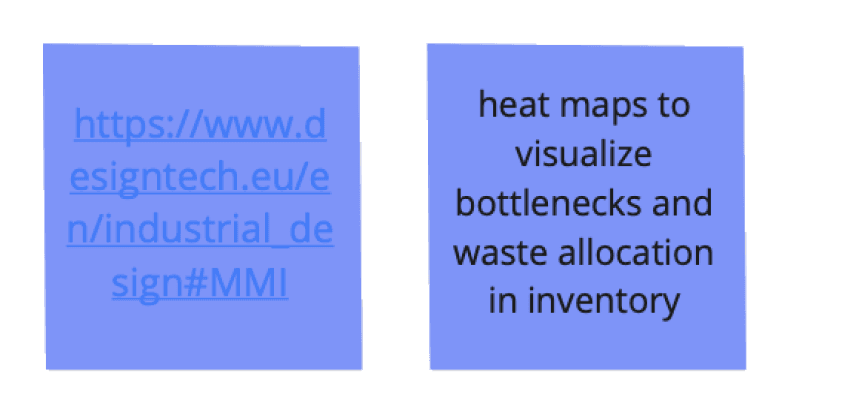
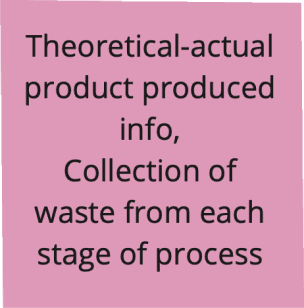
Clustering insights
Relevant information from speedstorming was grouped together for further research
Customer related
computer vision
Industry type
Long cycle time
trucks
Earth Movers
Tractors, cranes
Heavy machinery
Sell to lean & six sigma consultants
Sell to industry (continuous monitoring)
walking trajectories
Material tracking
RFID tags
Worker activity identification
Process mining with shopfloor mapping
SAAS
Design
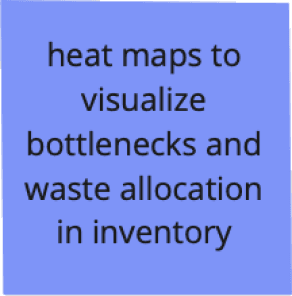
Heatmaps
bottleneck visualisation
waste allocation overview
Inventory monitoring
Data analysis
Optimisation
Digital value stream improvement mapping
Dynamic line balancning
Production speed change
Alarm system if wait time exceeds
Throughput time improv
TAKT time improv
Waste statistics
sustainablity rating index
RTLS
Time stamp monitoring through IPS
Stakeholder mapping and prioritizing
Mapping the key stakeholders for serving the technology, for forming insights and questionnare
Manufacturing unit
Executive board
Workers council
Head of production
VP of operations
Continuous improvement director
Continuous improvement Manager
Expert team
Project team
Procurement Department
Logistics manager
Lean implementer
QA, QC employees
Workers/machine operator
Plant shopfloor manager
IT Department (3rd party)
Maintainer team
Data Security officer
Monitor
Keep satisfied
Keep informed
Manage closely
Interest
Plant manager
QA/QC employees
Power
Machine operators
IT Department
Workers council
VP operations
Production Head
Lean implementer
Pl
Q
M
I
W
V
Pr
L
Stakeholder positioning
Size relevant to authority
Brainstorming the product lean canvas
Possible Solution
Continuous process mining for discrete manufacturing.
Monitor long cycle times and reduce waste by auto feed data in, check sheets, cause & effect dia, pareto charts, scatter plots, histogram, control charts
Revenue streams
Digital Lean consultancy services
Subscription of software and cameras
Data analysis which can predict future value stream mapping via video analysis.
Training services using Ferblick data analytics and fusing them into six sigma practices.
Problems Identified
Disorganised Time and motion waste manual analysis in discrete manufacturing.
Manual cognitive cycle time analysis (sample sizing).
Inefficient VSM based
on sample size (month,quaterly).
Mapping difference between standard SOP and actual man material process flow.
Errors in creating check sheets for organising and analysing data.
Unavailability of Predictive analysis of throughput time in customised production
No standardisation Change management
and OLE for highly customised manufacture.
Unique value proposition
Identifies Poor allocation of tasks between machinery, people, steps in a process,Inefficient floor layouts.
Unfair advantage
Quick and inexpensive
setup inside the factory.
Predictive analysis of motion waste improvements &
efficient change management.
Cost structure
variable proportionally with the volume of analytics or services
value creation. Premium Value Propositions and a high degree of personalized service
Key metrics
80/20 pareto rule identify top Motion waste.
analysing Total work time, walking time, time spent between each stations
Estimation of total time and motion reduction if
activities reduced
by x%
AI potential
Prediction based on video analyses of motions causing long delay and how to eliminate it in a similar discrete production.
Anomaly detection of motion through heat maps, scatter plots, spagetti diagram .
Content generation of process map identifying 80% of problems by highlighting 20% of high prevelant issues.
Data generating MVE
Video data of long cycles, process maps, check sheets, scatter plots etc, Tabulated time, distance, frequency.
Channels
Affiliate/SEO
Content
Customer segment
Aircraft manufacturer. (Long cycle time, plenty of motion, job production).
Lean QA consultancy (providing services for SME & LSE).
CNC,Die press manufacture (Long cycle time, plenty of motion, Discrete production).
Heavy industry service dept.(keeping track on time and motion waste to complete service and repair).
Automobile maintenance (Long cycle time, plenty of motion, Discrete production).
Product positioning : Perpetual mapping
Vision+Sensors
Vision AI
Guidance+Detection
Lean improvement
Insights from Competitor and Industry 4.0 studies


Continuous improvement AI solutions Gap
Startups are more focused on “short cycle times”
Solutions are available for “Continious production system”
“Short cycle time” production example - Engine,
laptops, phone, pcb assembly
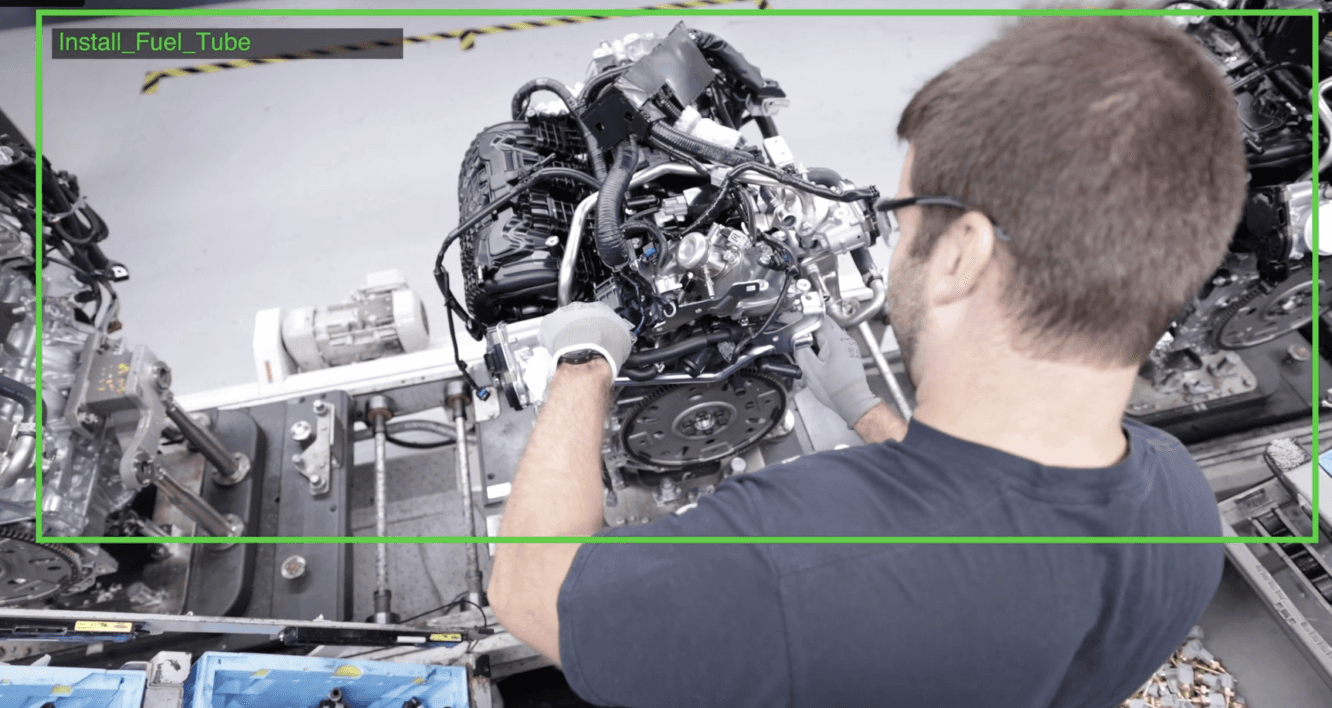
Install fuel tube
Focus areas
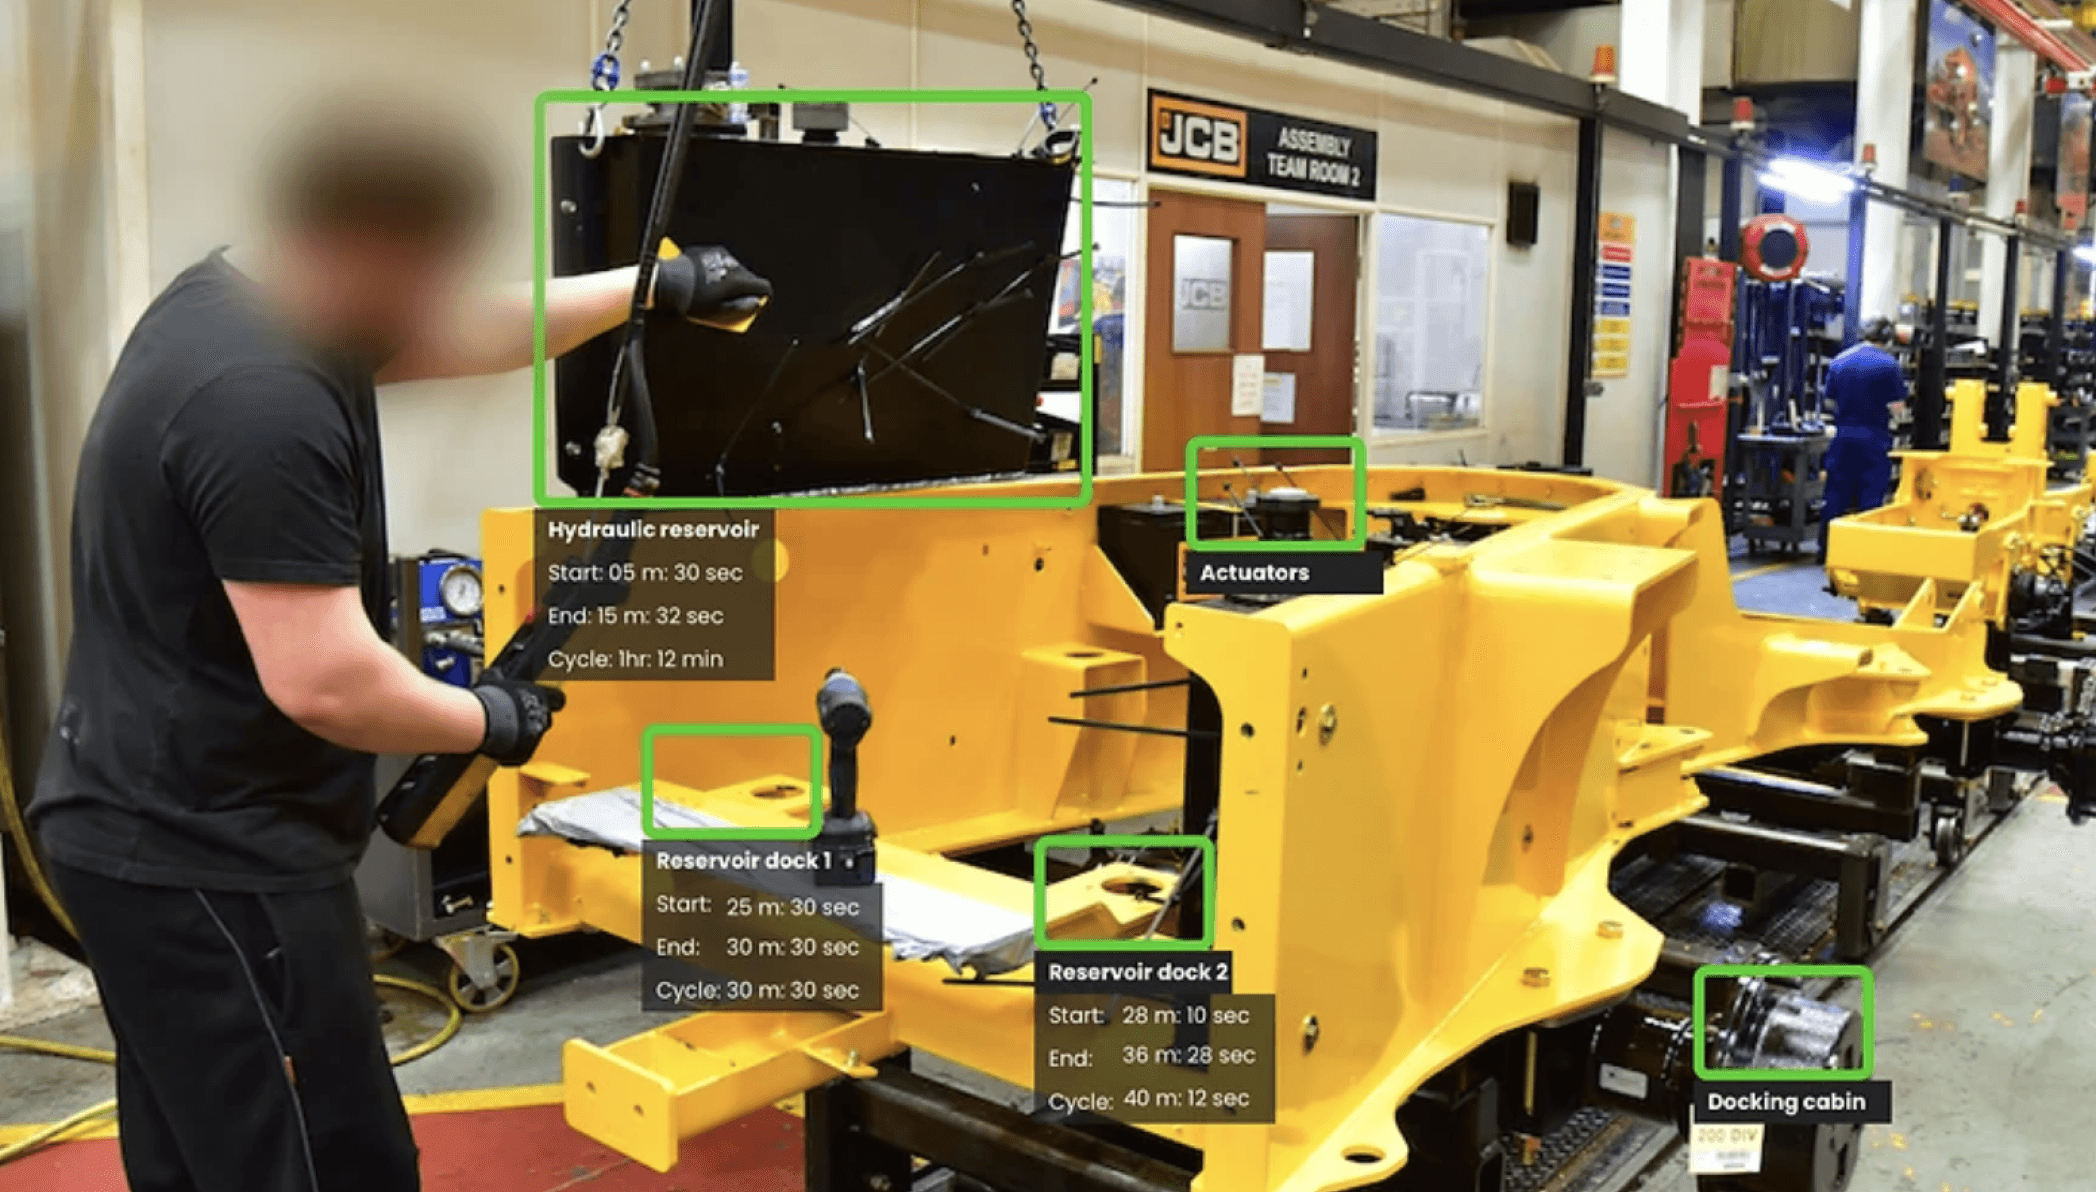
Focus on areas around “long cycle times”
Target Discrete production systems
Potential areas: Aircraft systems, Cranes, earth moving equipments
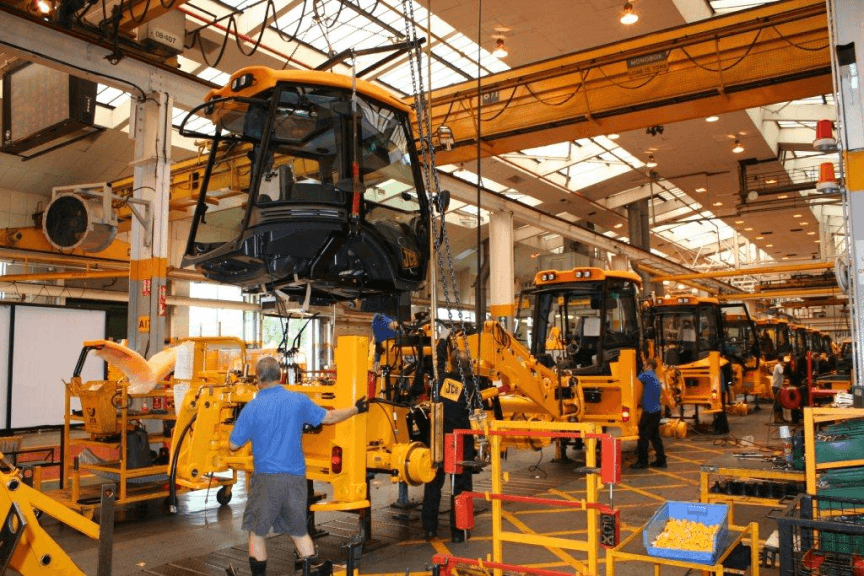
Docking cabin
Competitor product and tech overview
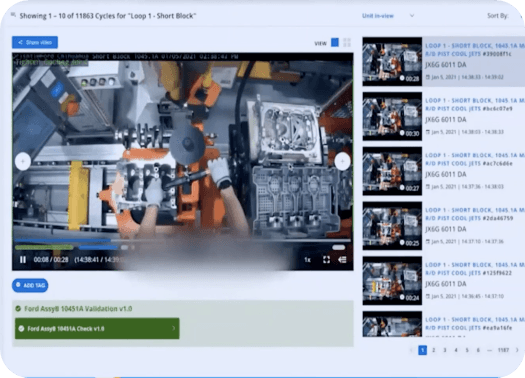
Analysis overview
Competitor name
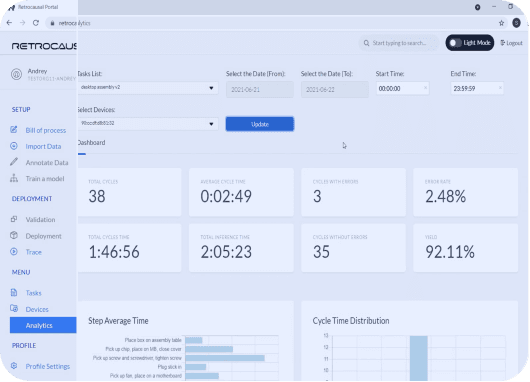
Retrocausal
Camera Realtime alert
Cumilative/Hrs/Months
Blurred Identity
Blurred Identity
Centralized usage stats
TAKT/Cycle/Throughput
Identity not blurred
N/A
Connected dashboard N/A
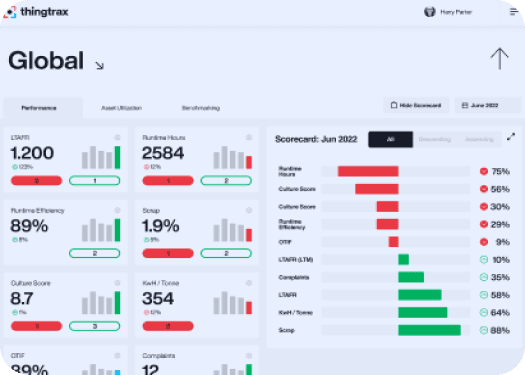
Global Production Dashboard
line production overview
Track availablity/performance
informs training readiness
Monthly/Shift wise reports
Monitor interest regions (ML)
Job plan, Historical analysis
No code app (operator build)
augments productivity
cycle time defect traceablity
Root cause analysis
Rapid A/B test on factory floor
Line associates live training
Monitor Helment/Masks/gloves
Checks missed steps
motion/placement/action
only hands detected
individual stations
Builds QA reports in 4hrs
Thingtrax
Tulip
Drishti
Production and process analytics
Assembly monitor
labor Privacy
Shift management
Saftey monitor
Production planning
Global dashboard
Production training
Live task guidance
Quality assurance/control analytics
Product Screenshot
labor skill matrix
Process improvement
Mistake proofing
Hardware
Audible & visual alerts
QR code MES Detect
Biomotion
Hardware
Overhead Cameras / Bay
Sensors/Cameras/RTLS
Inexpensive overhead cams
OCR/Visual/Color Depth
Visual color coded
2D/3D Jig Detection
Zigbee connected monitoring
smart shoes/ gloves/suit
Cameras/RTLS
Camera/ MES
Data extraction and analysis
Scoping
Data Analysis
Data Extraction
Presentation
Material tracking
Motion tracking
Process overview
Cycle time
Working time
Walking time
Mean/max/min time
process graph
check sheet
tables / heatmaps
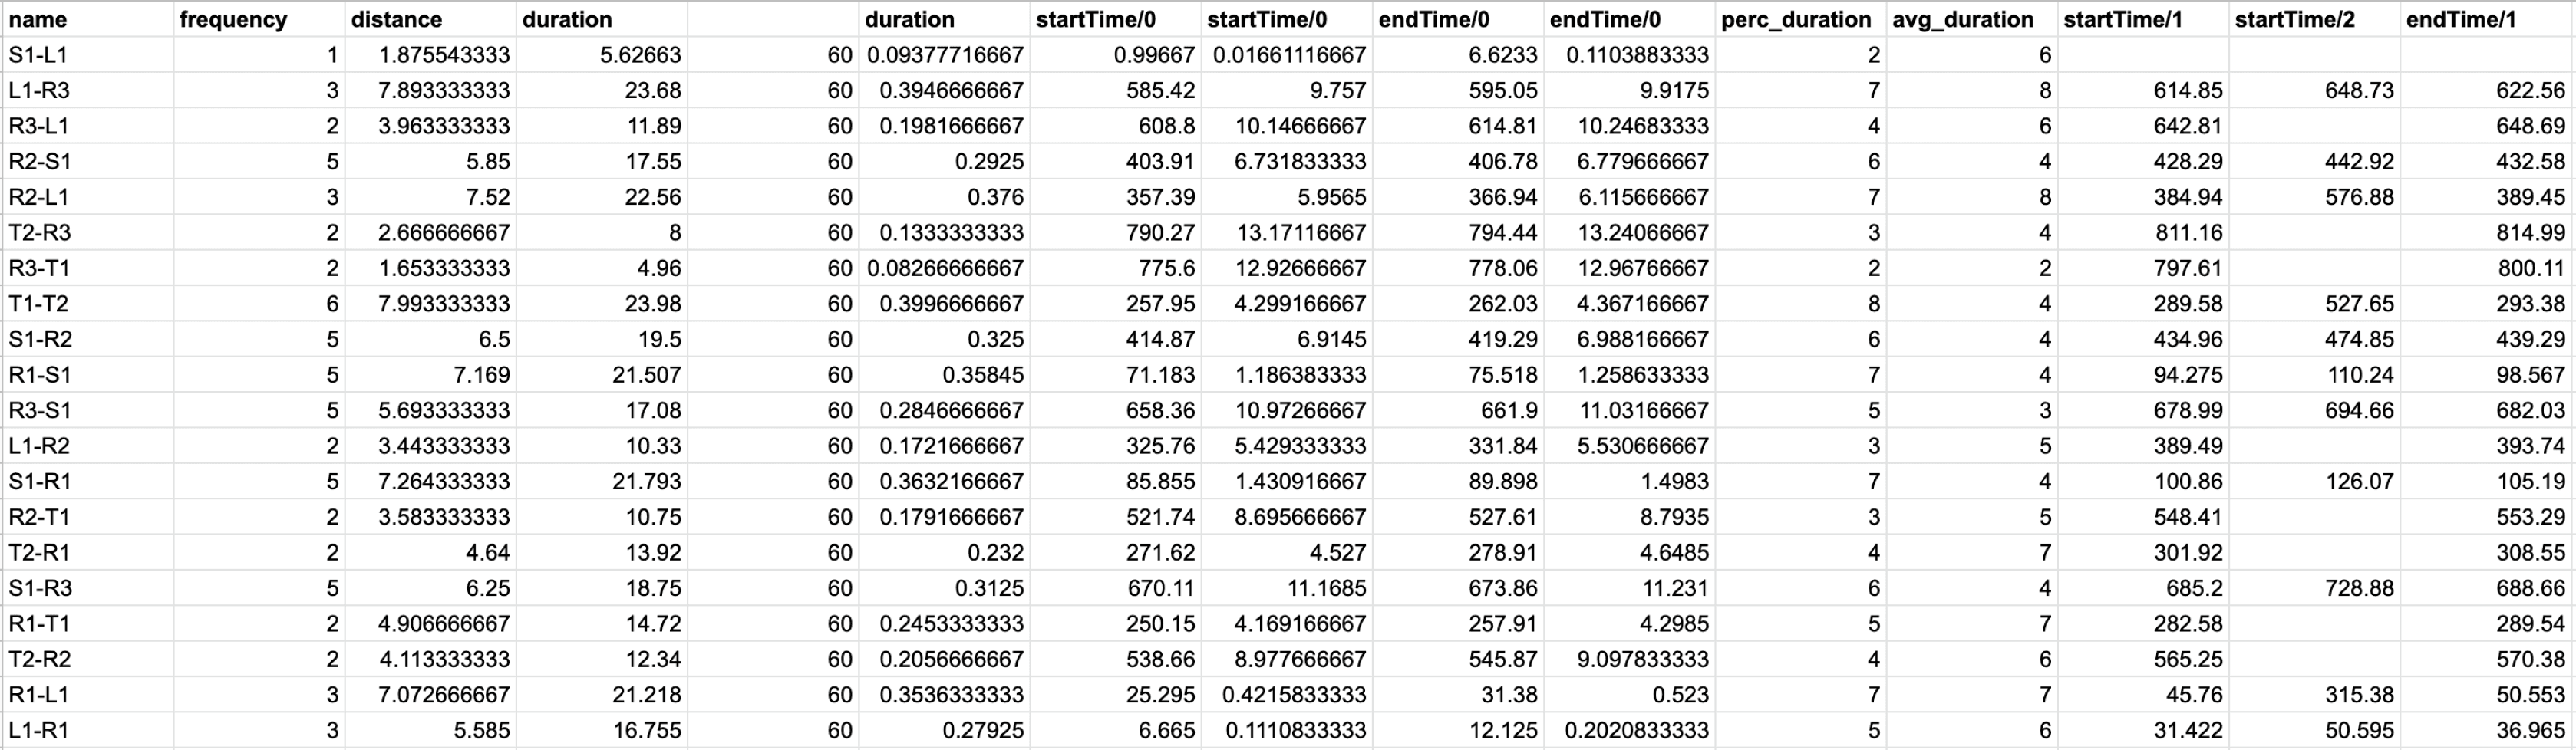
station labels
Frequency activity
distance, time, Avg
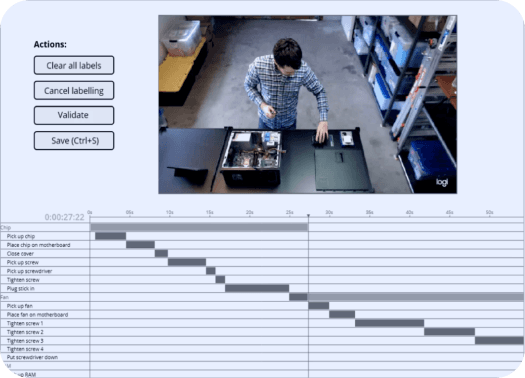
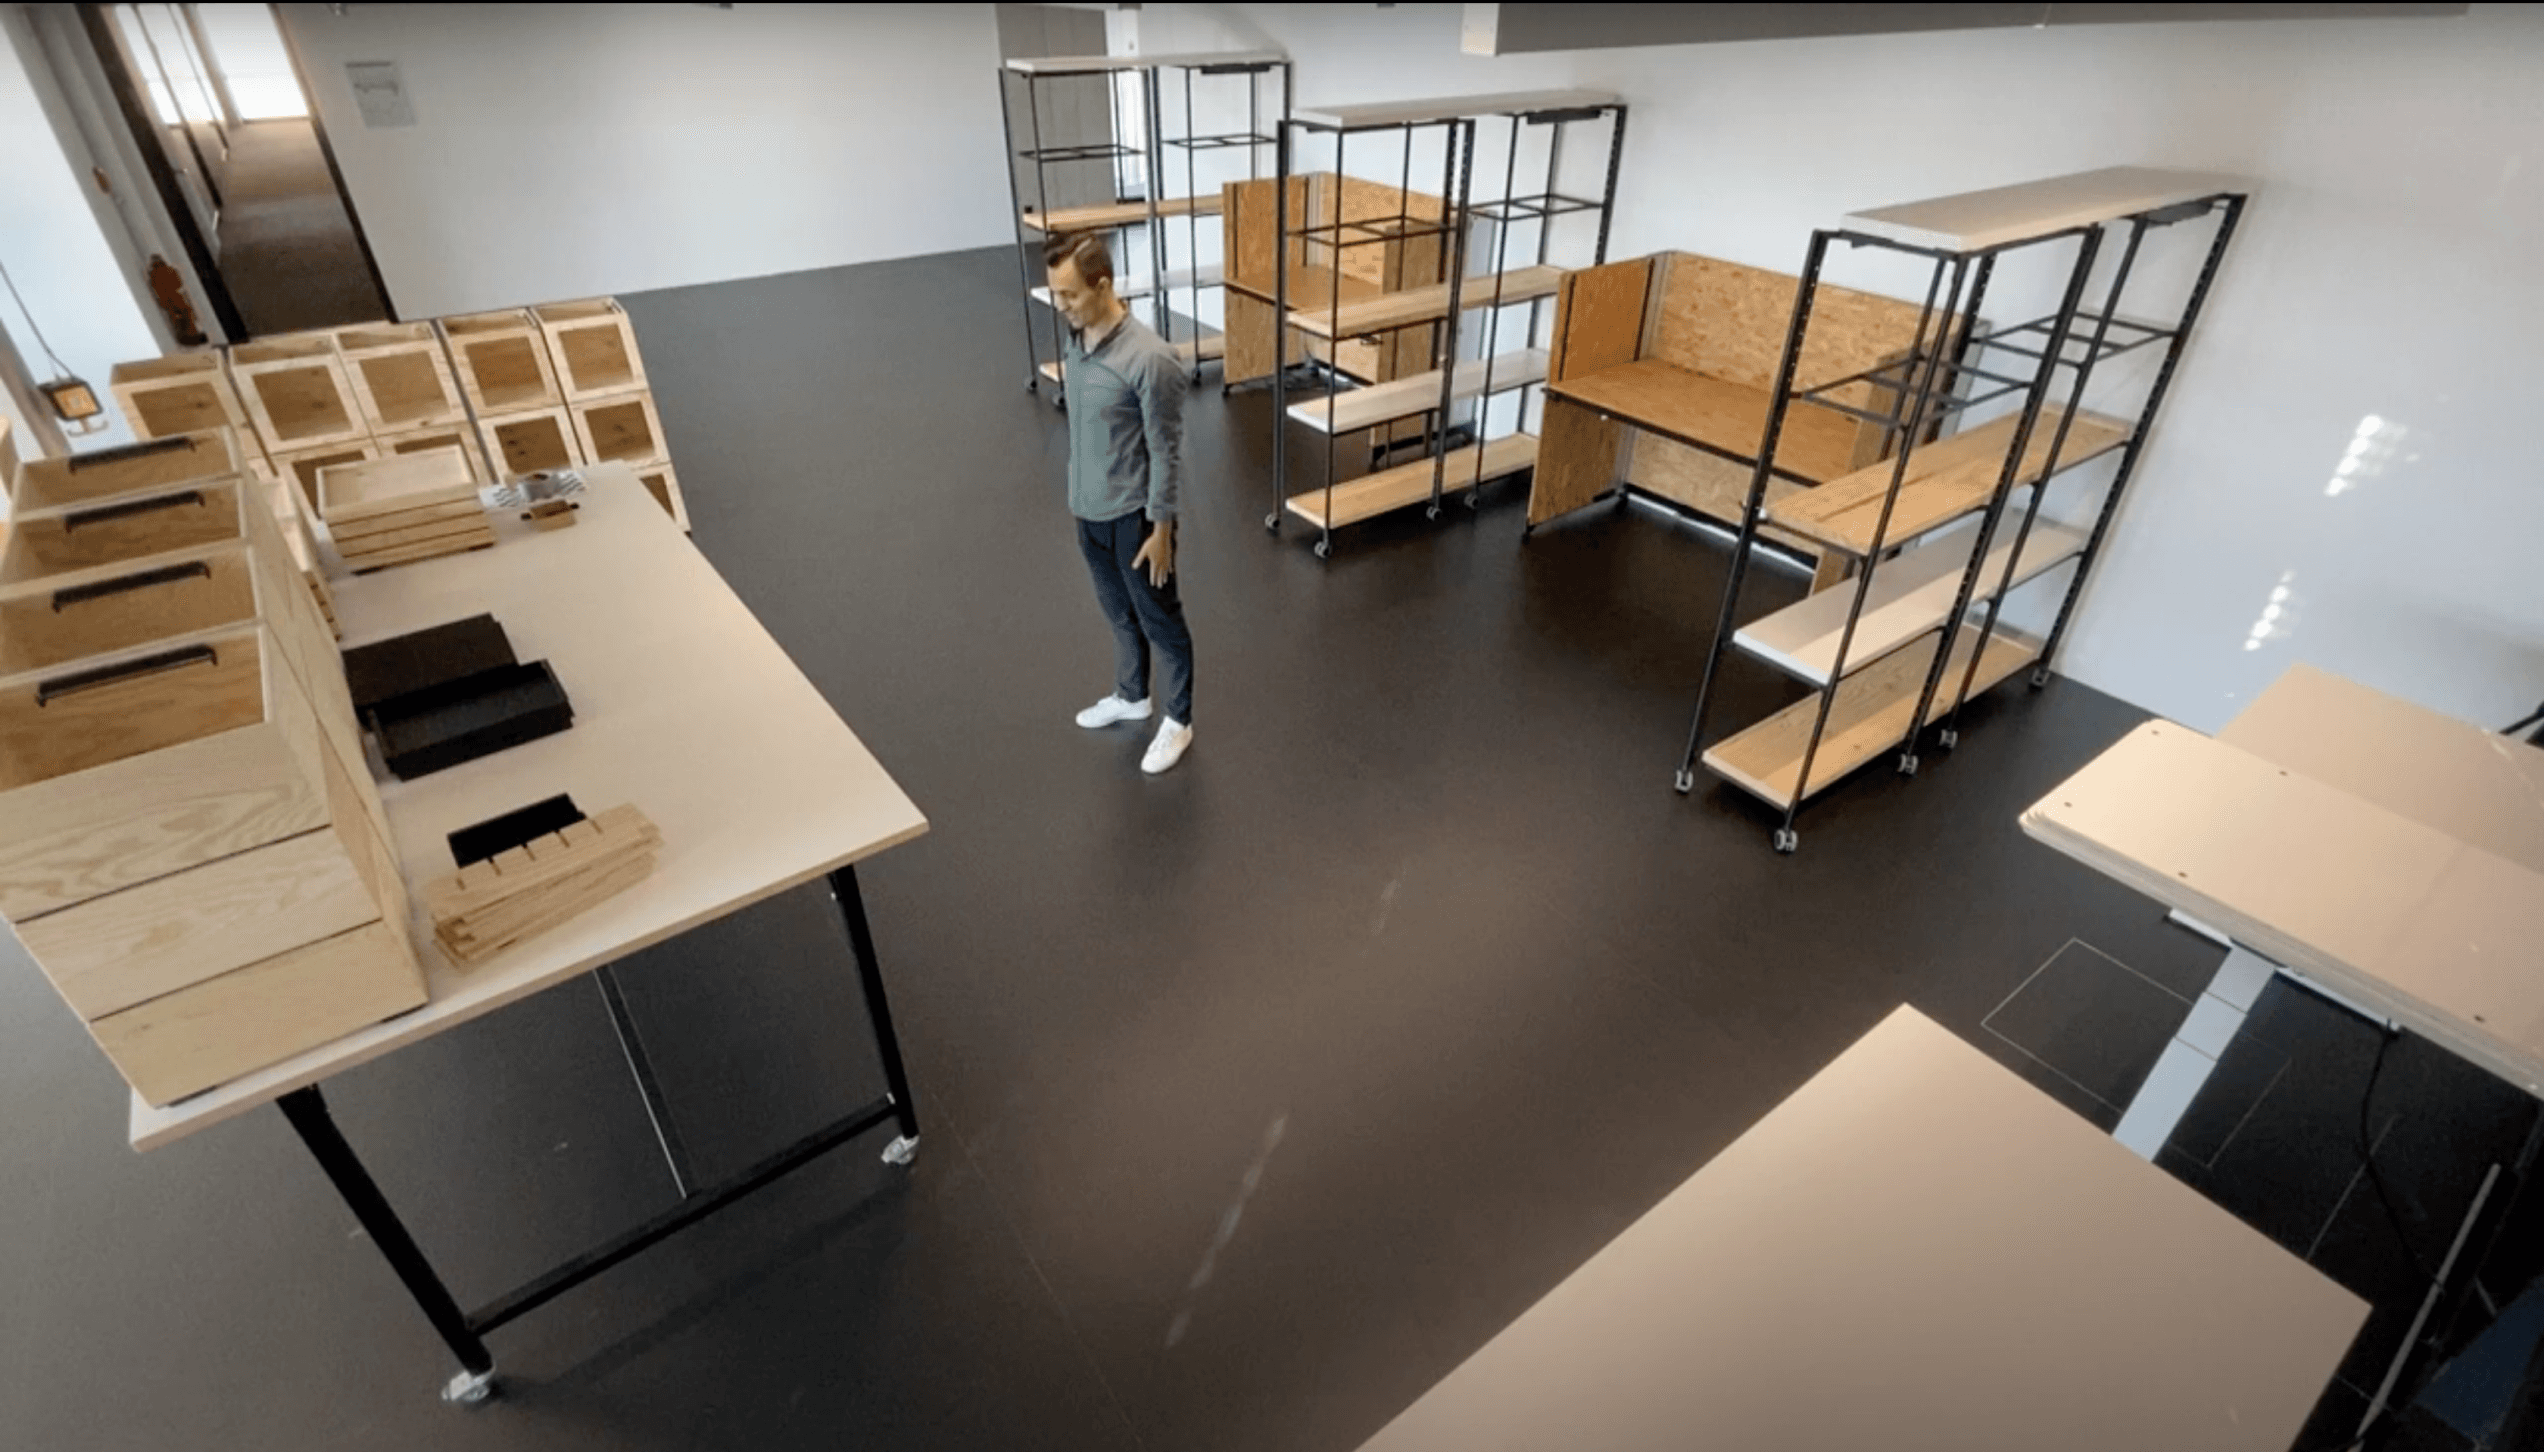
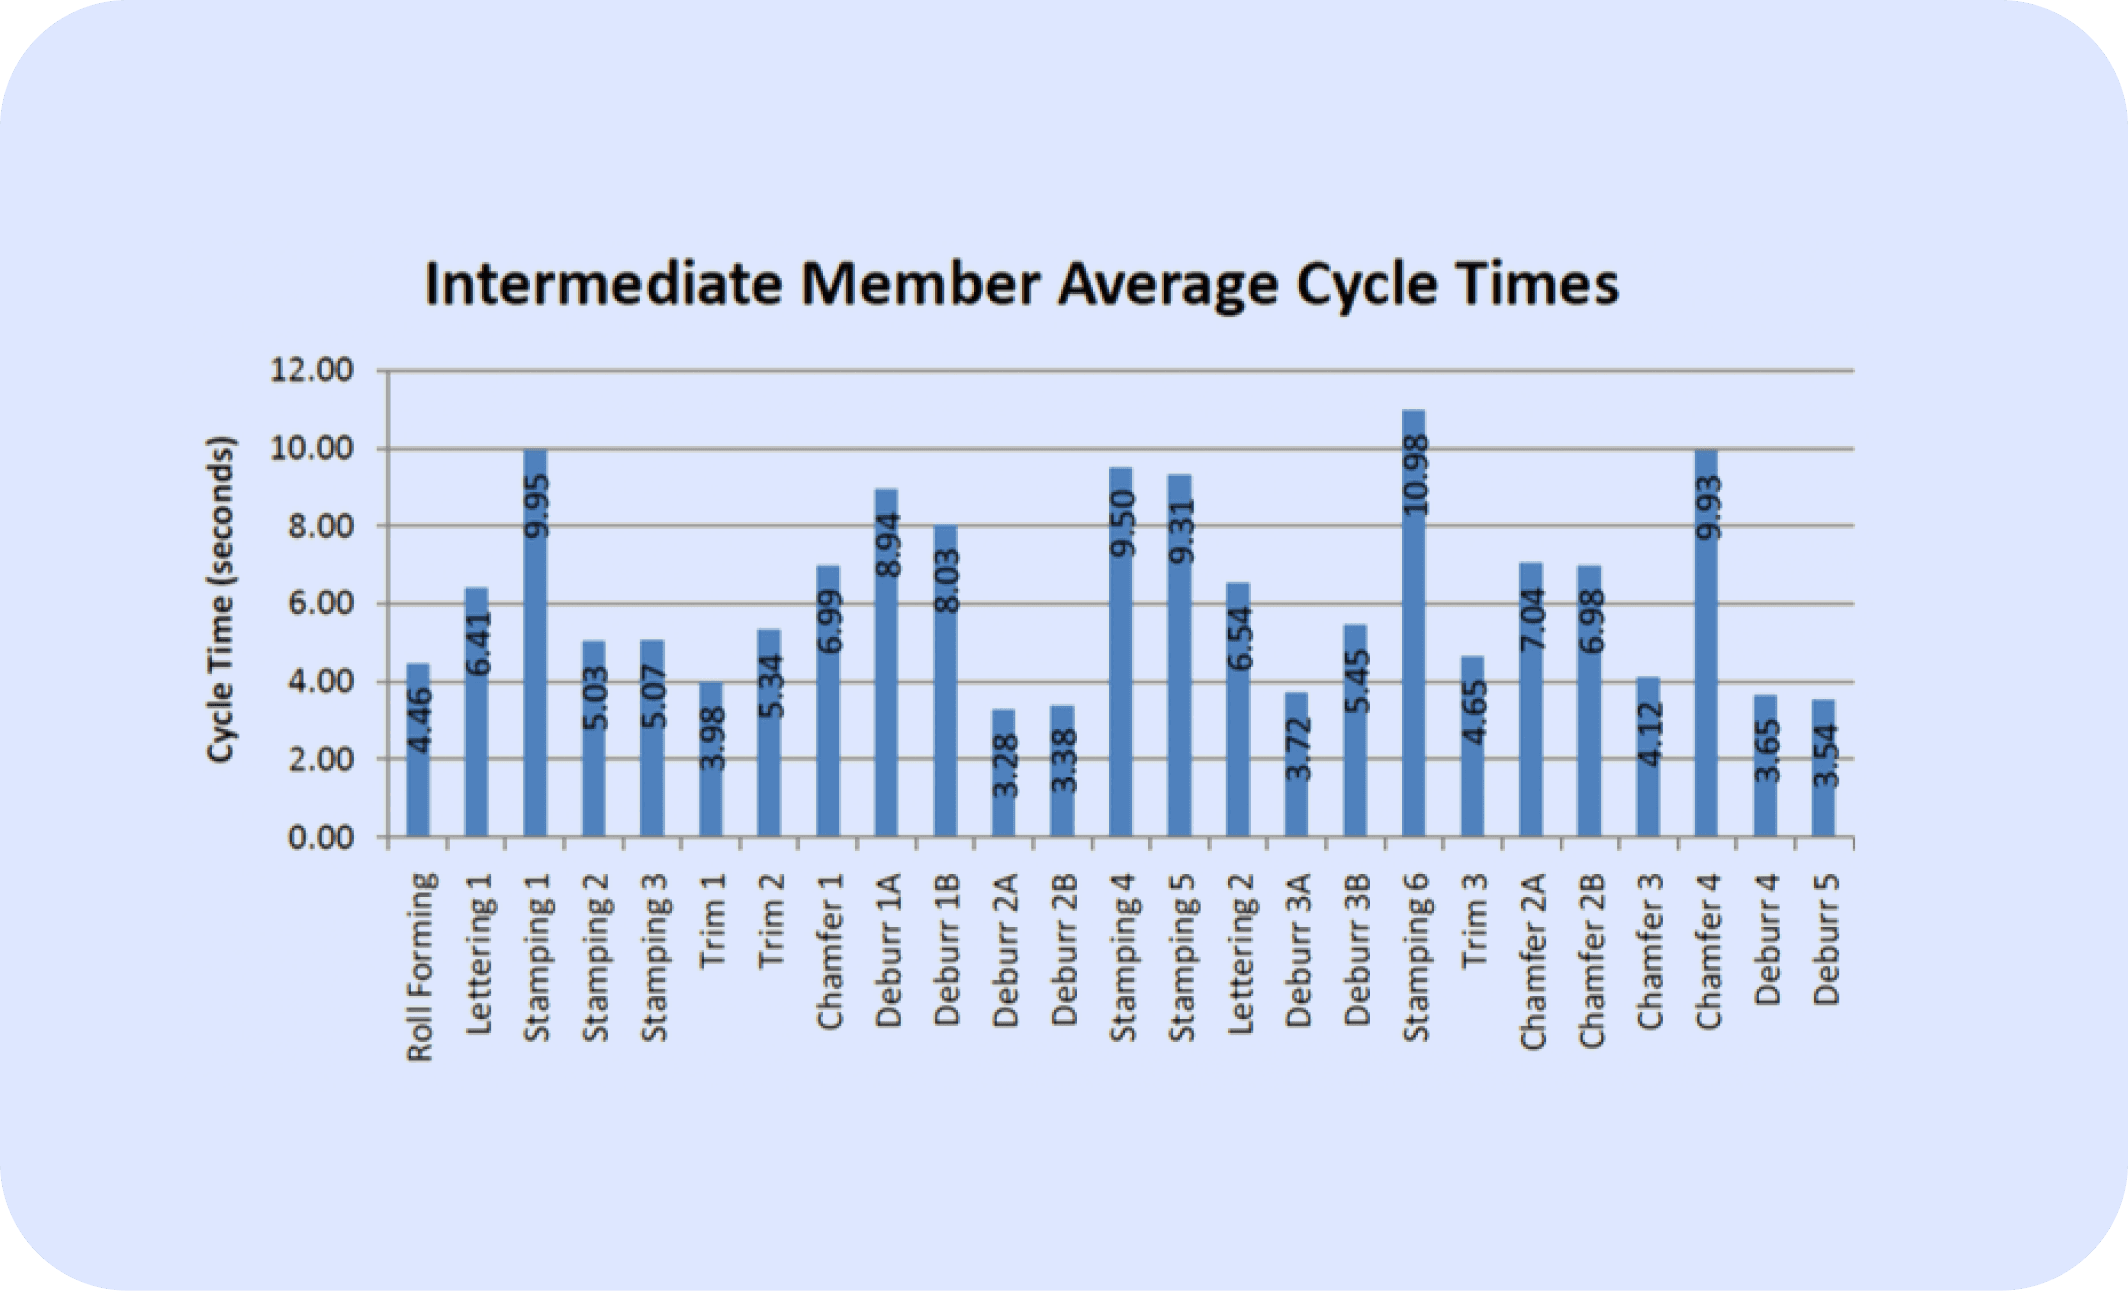
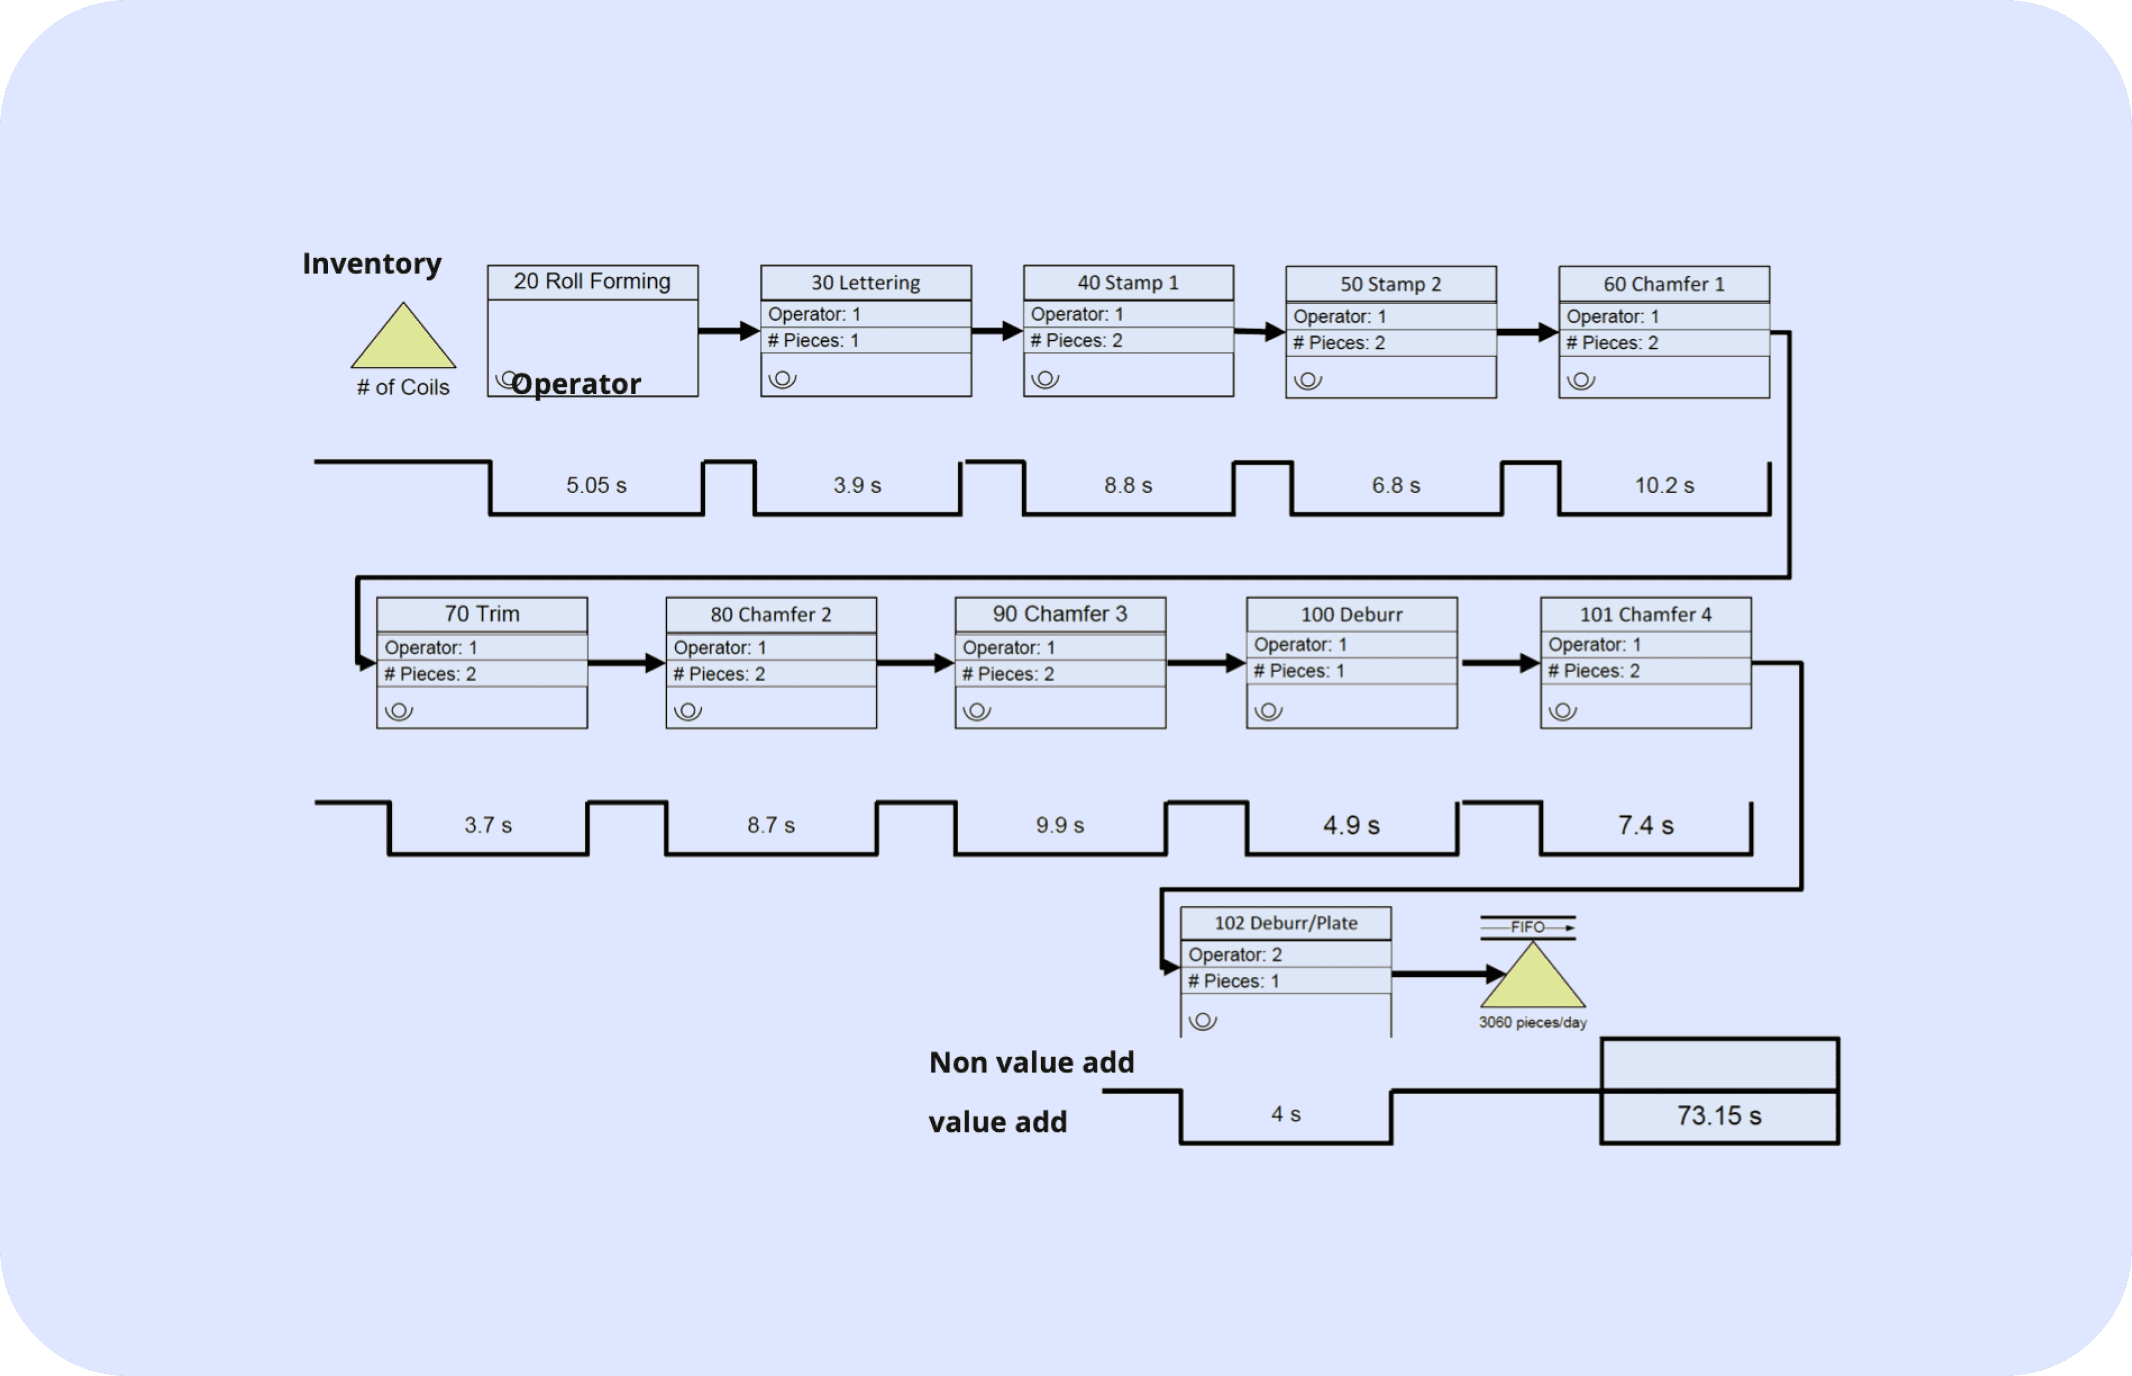
Mockup Experimentation of data to be analyzed
We created a mockup assembly setup inside the studio, to extract some data and identify the parameters that we can put in ui mockups.
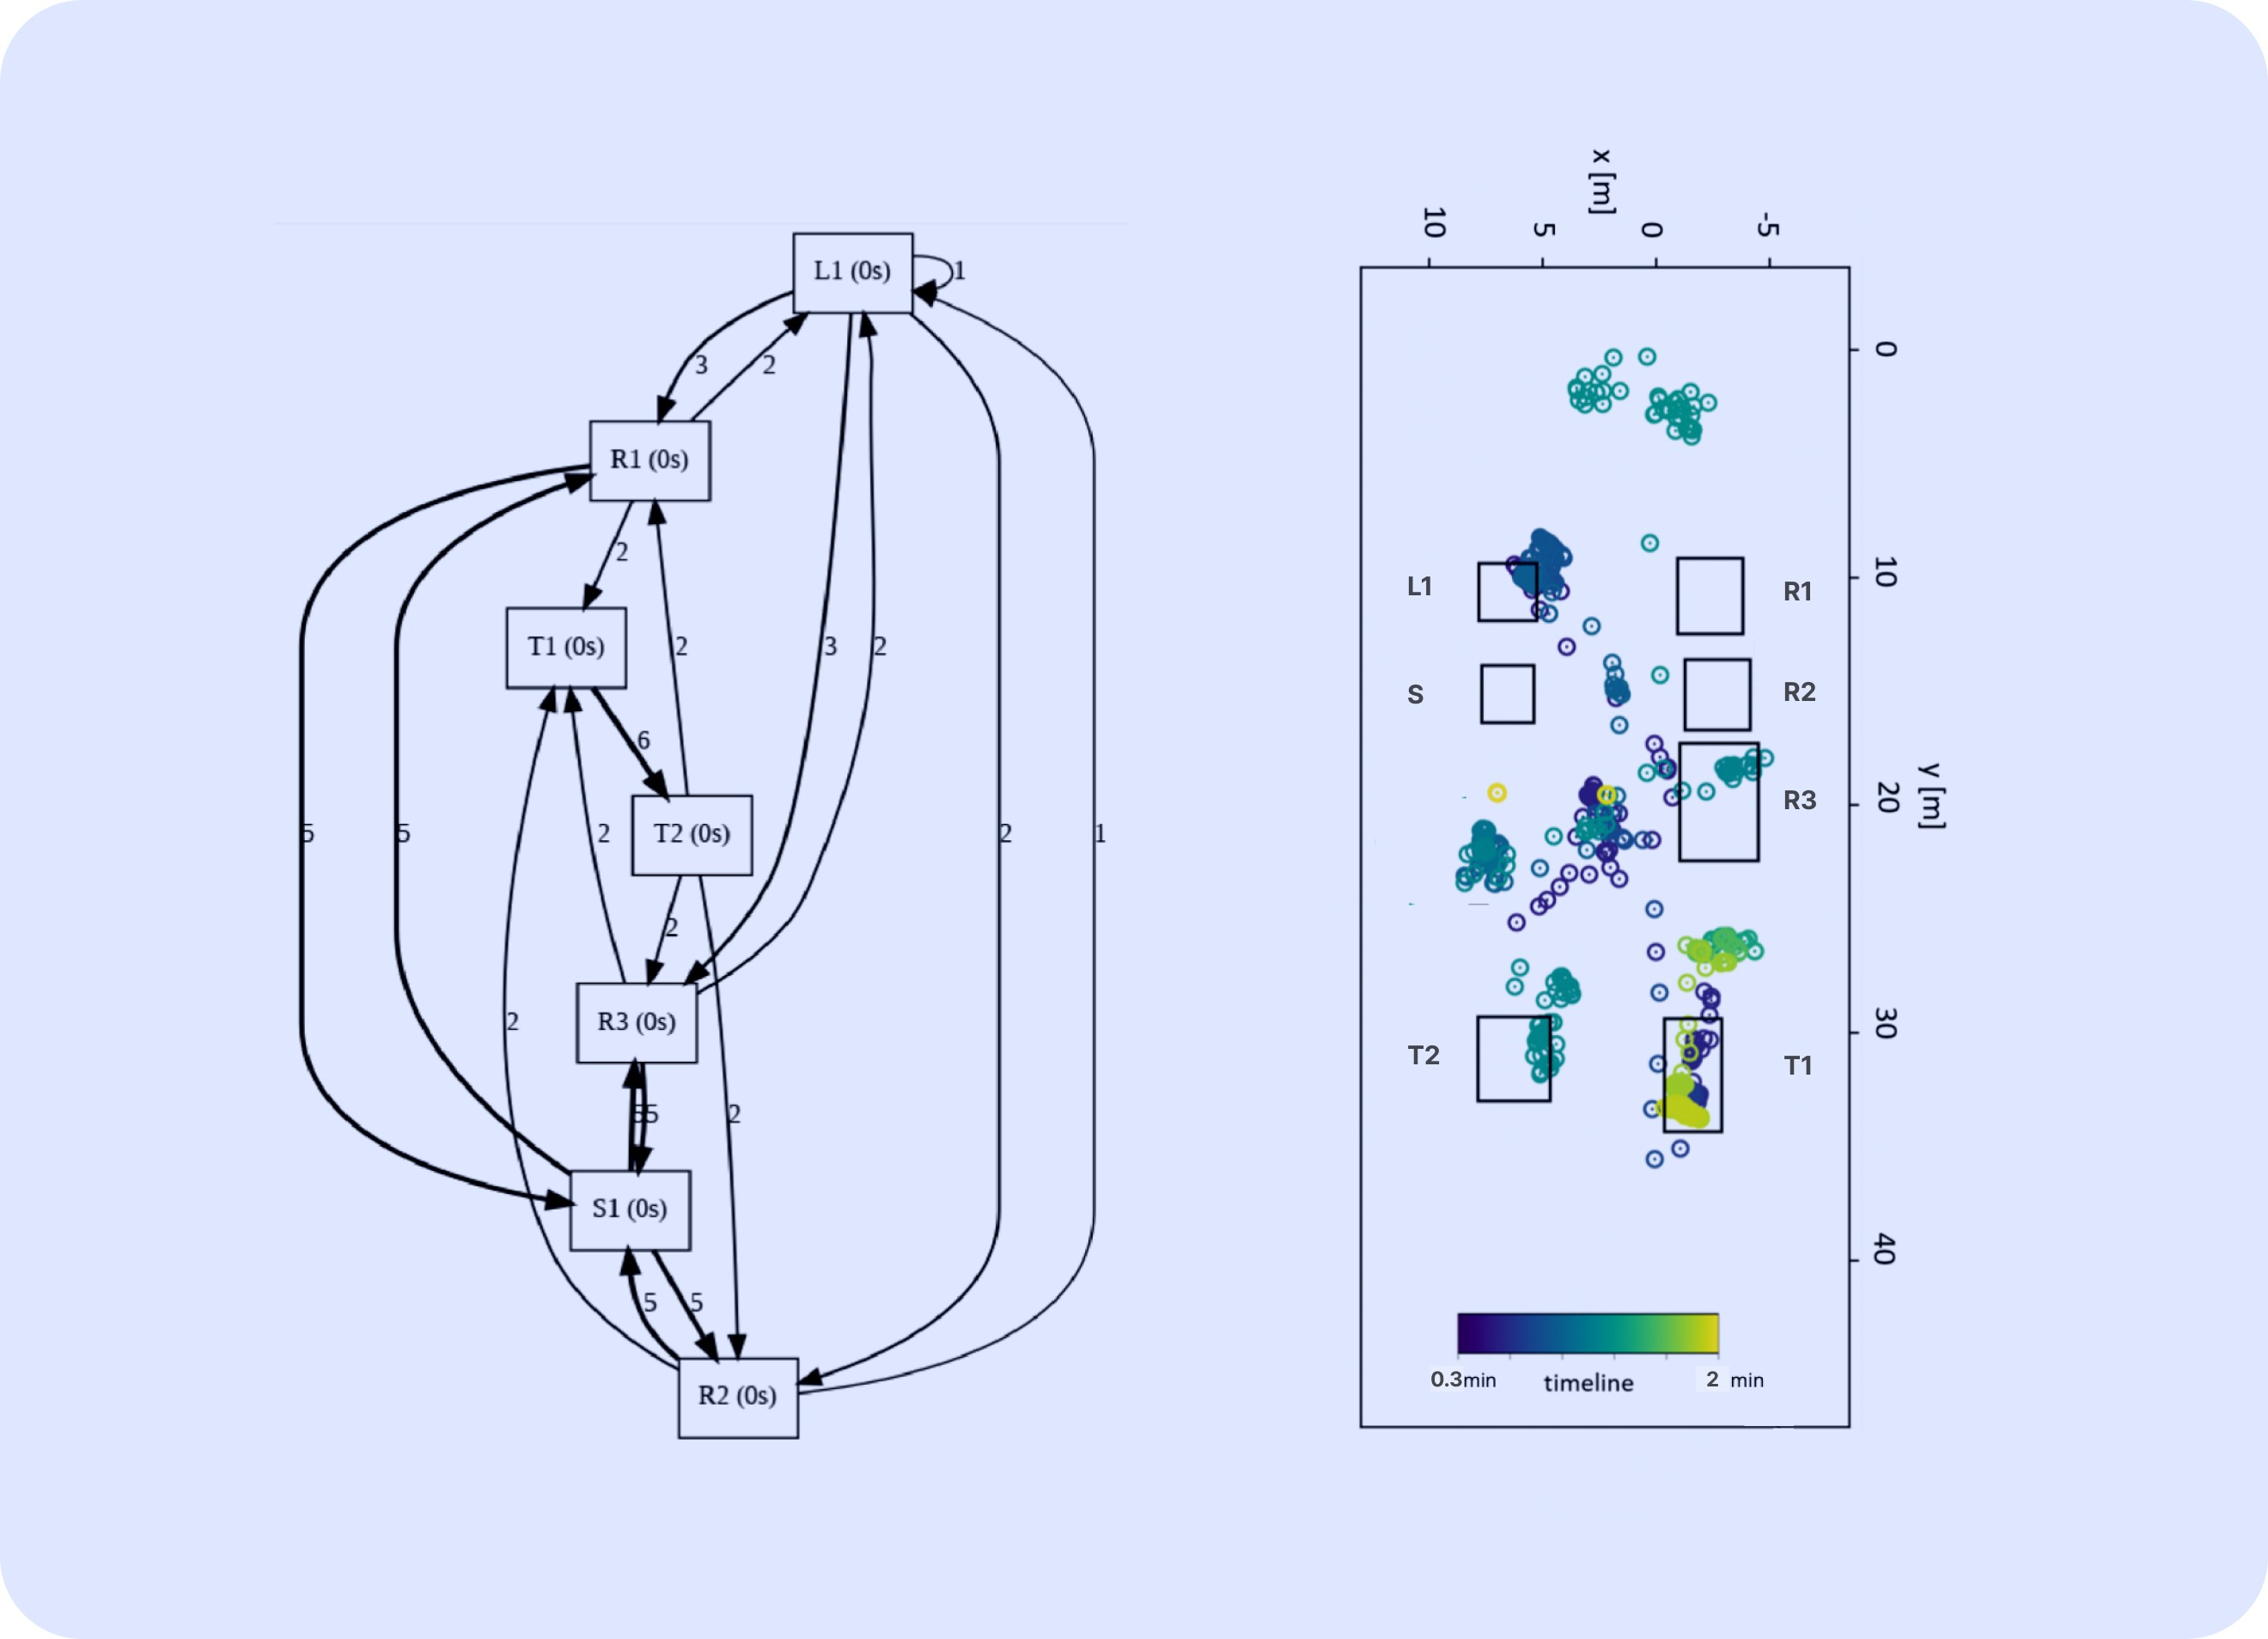
The output based on event logs using PM4PY
It was important to understand the raw graph sheets and activites around all the stations to efficiently convert them to interactive dashboards
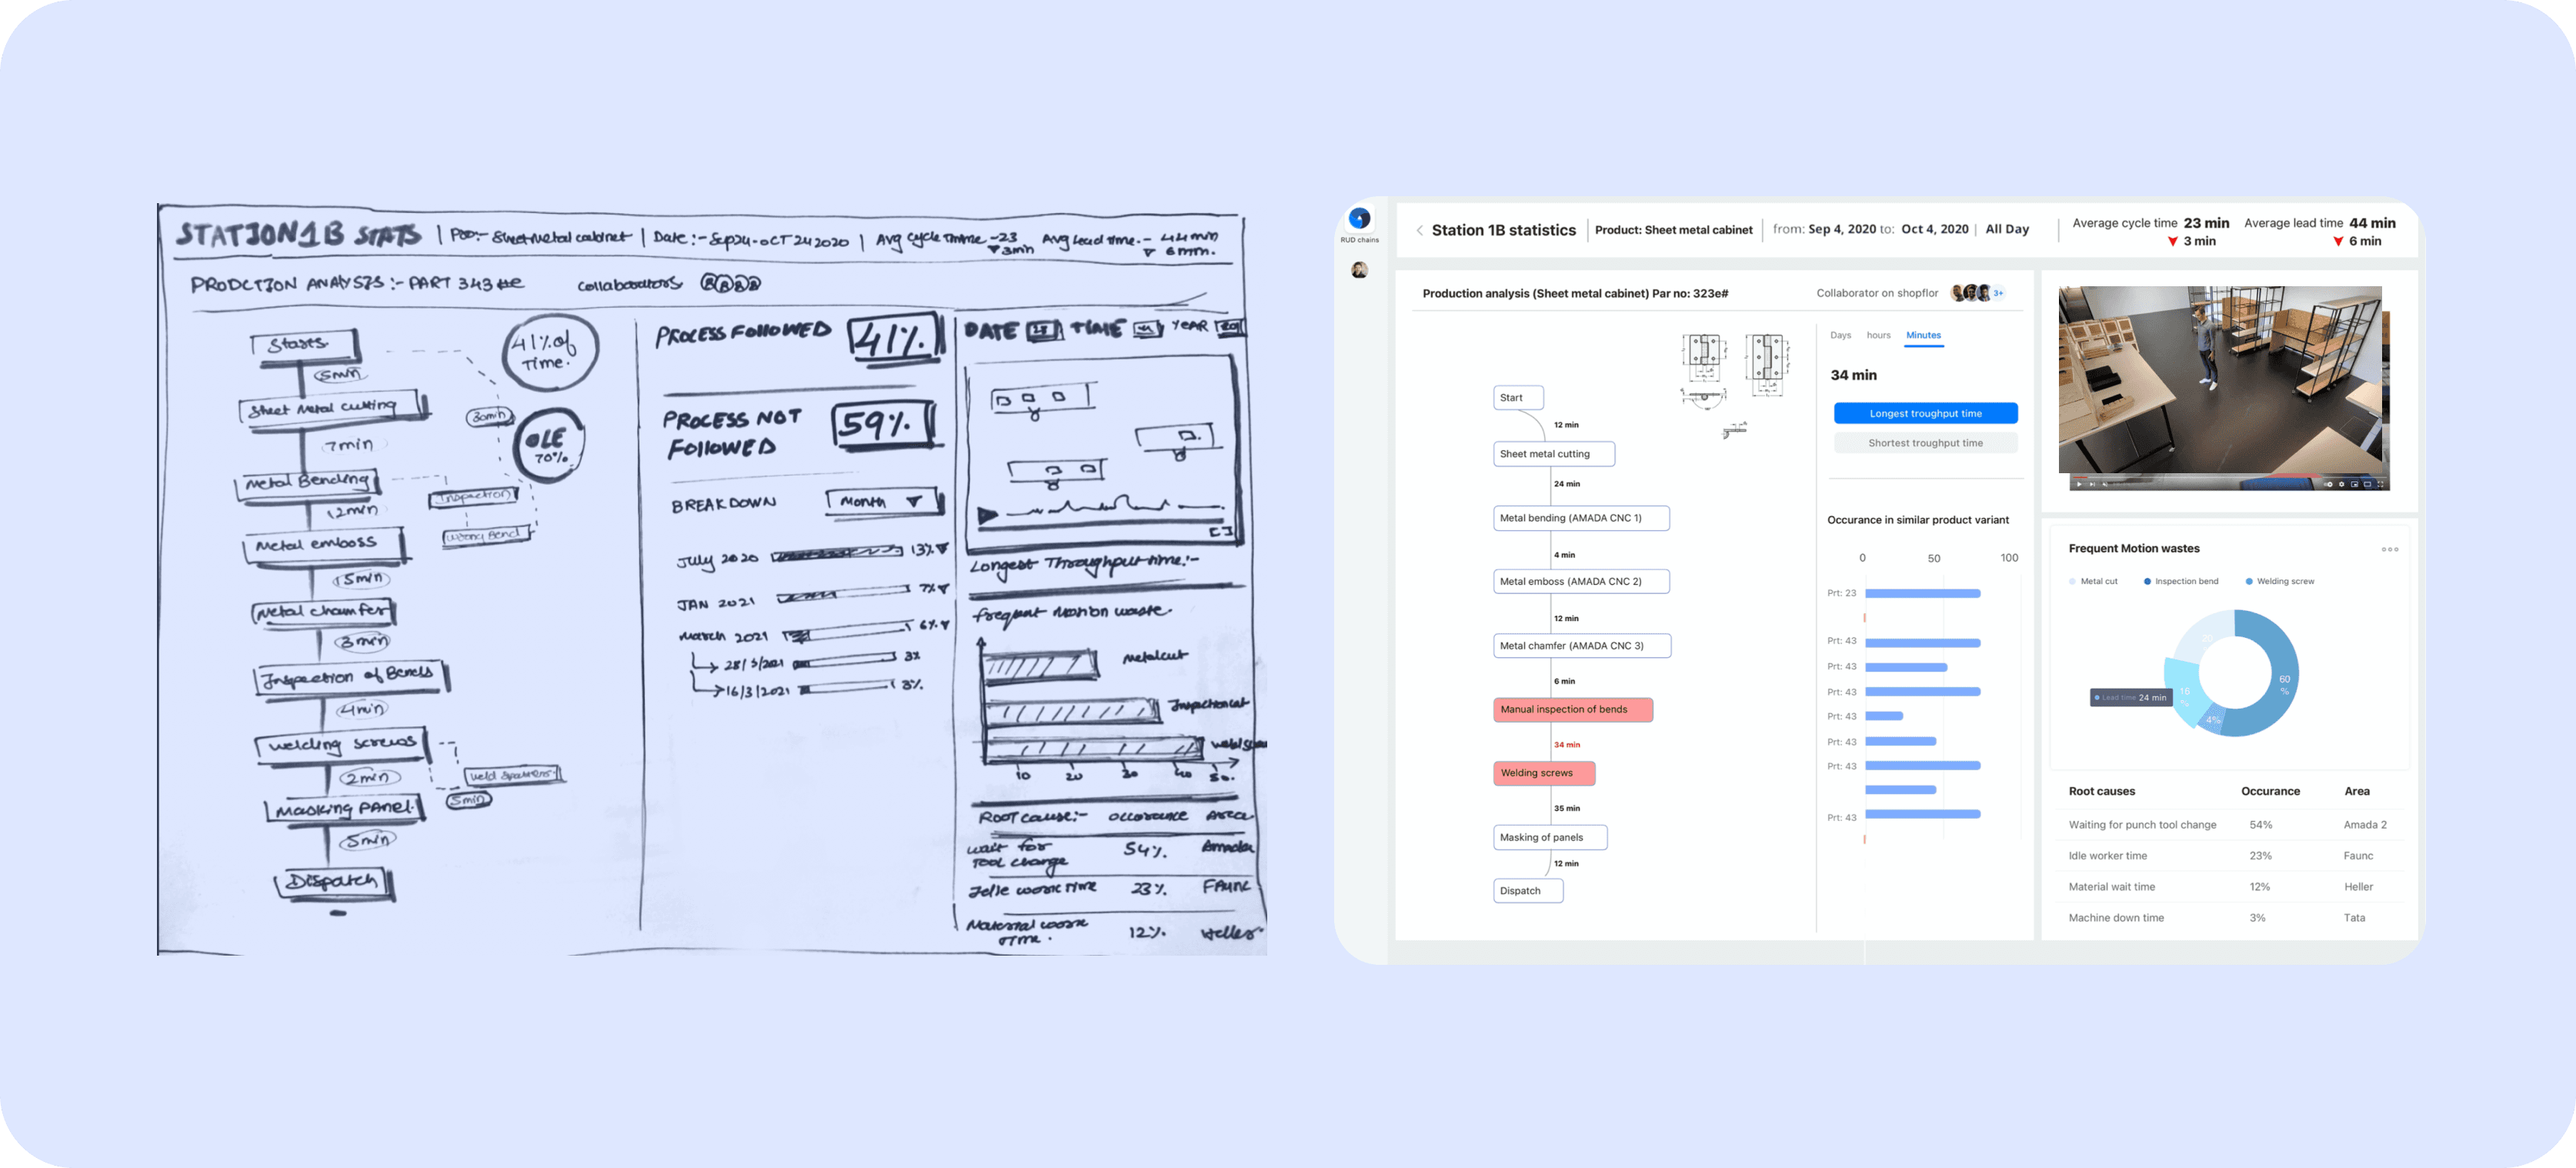
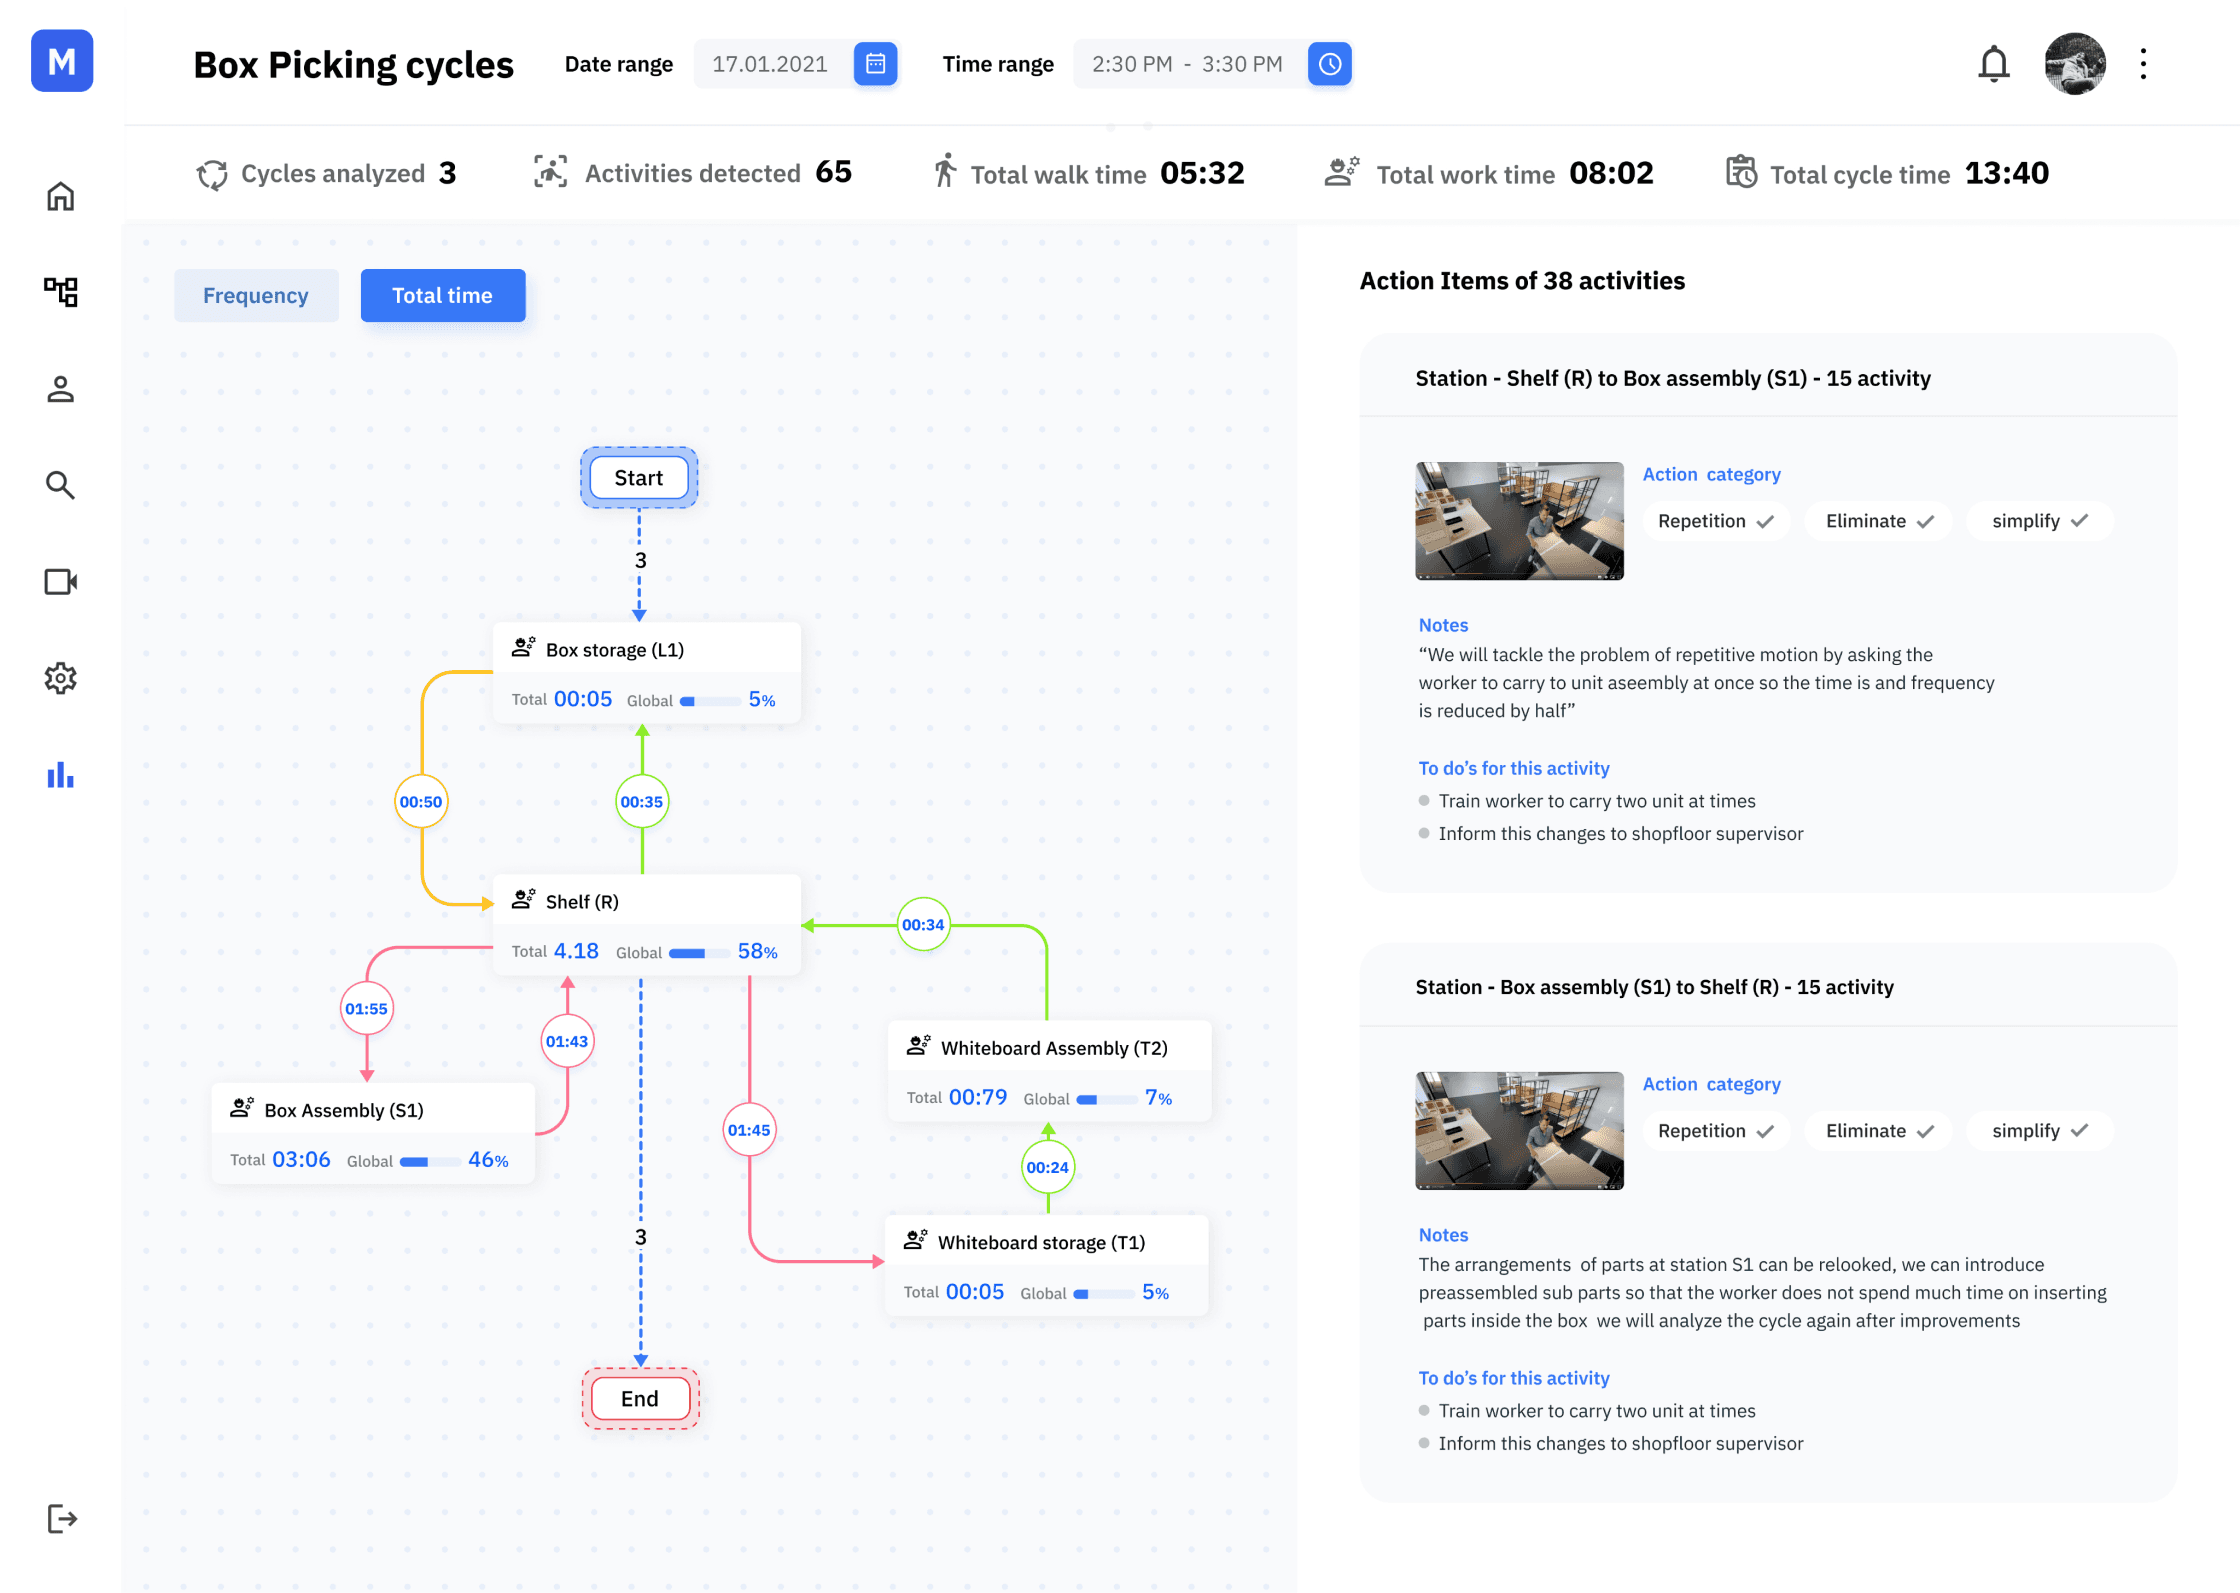
The very first design mockup based on research findings
From the understanding gained by competitors, seconday analysis and mockup of process data we visualized what parameters would be useful to put inside the wireframes.
“Inventory and material and motion distribution is uneven if you are not producing in takt time”
“Balancing the amount of work inside each station is necessary for efficient production”
“lot of potential in the process (Man+machine motion) control and the rest around you can manage the inventory,"
“So looking at process and reducing all wastes till it reaches 6 sigma is crucial”
“For New production units cars lean managers spend up to two months on shop-floor standardising the process”
“focus on industries which do not work on TAKT time”
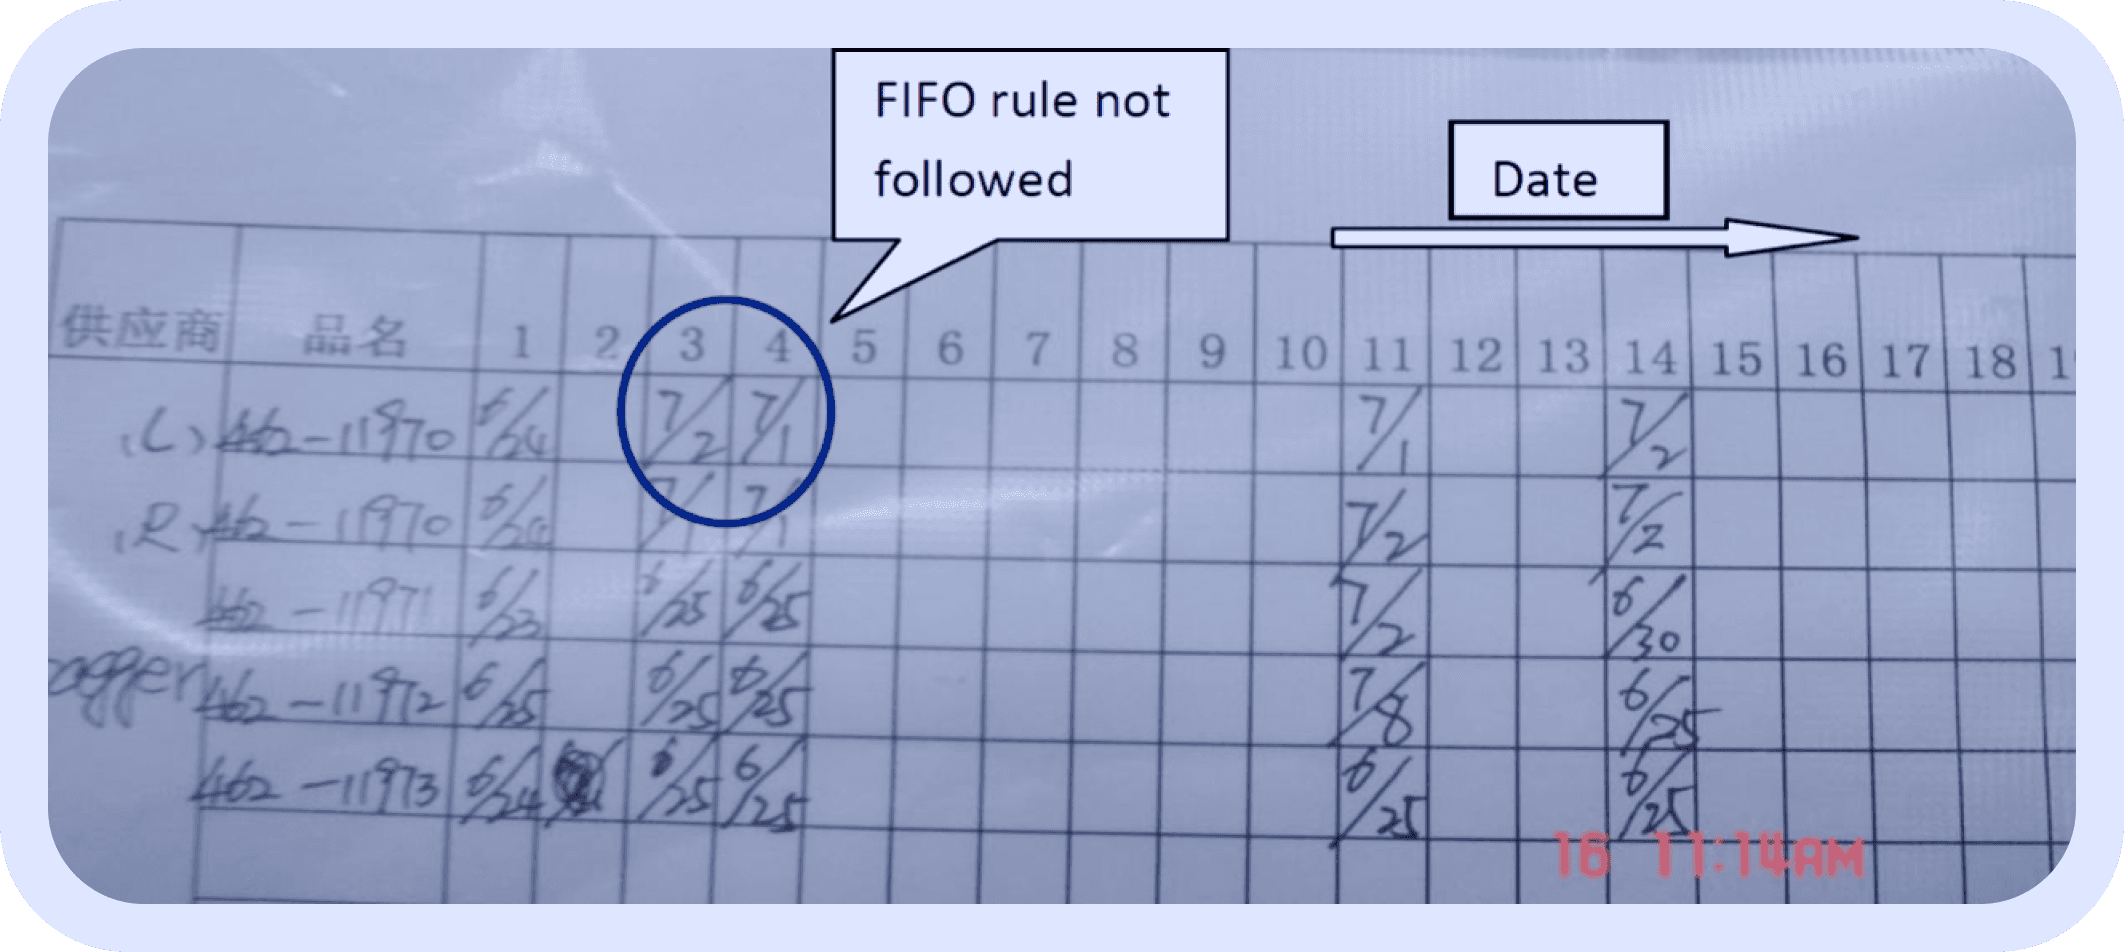
“Recording manual data of assembly process taking more than 2 days is tedious”
“Calculating value stream,cycle time, TAKT time is more difficult for long process”
“Waste of motion is the biggest concern”
Interview insights from Quality engineers and lean managers
Weekly interviews were conducted with stakeholders and we visited a factory plant to understand how manual process are followed
and time taken for mapping the process.
Iterations based on the interview insights
We gained some insights from interview and shop floor visits. These cumulative insights were then translated to mockup for further testing of hypothesis.
no clear
evidence yet
already well validated
with evidence
very critical
for success
unimportant
Video analysis are more efficient than manual quality control statistics
Value stream mapping can take up to two weeks during a 3rd party inspection (manual)
Process graphs are more efficient than VSM
With digital QA/QC simulations permutations combinations of tasks can be tweaked
Ferblick can provide 7 QC statistics without manual entry - production time sheets, check sheets, cause and effect diagram, scatter plot and control chats.
What are our assumptions/questions about target audience
& their needs and problems
Assumed needs and desires
continuous monitoring and improvement of shop-floor activity.
Analyzing statistics of lead time of entire year/Month/day/hr.
Identifying wait time in processes that causes delay.
Balancing activities between station for production efficiency.
Removal of repititive non value added motions.
Quickly create and deploy action plan and monitor process.
Monitor flow charts to reduce motion wastes.
What assumed problem are we trying to solve?
Digitizing lean improvements
Reduce QA/QC managers work load so that they work with evidence based facts and improve process with accuracy
Helping lean managers with all 7 QC statistics without manual entry of charts and production time sheets, check sheets, cause and effect diagram, scatter plot and control chats.
What hypothesis can we formulate?
Process graphs are more efficient than VSM
Video analysis are more efficient than manual quality control statistics
With digital QA/QC simulations permutations combinations of tasks can be tweaked and seen
how much % saving of time and money can be achieved.
Value stream mapping can take up to two weeks during a 3rd party inspection and ferblick can monitor
VSM remotely and continious.
Potential Ideas to test with users via mockups before building them
Visual analysis of tools
and euipments picked up and placed back (time motion study)
checked if they are placed efficiently through rechablity point of view
UI/Wireframe metrics
Material/ tool identification
Station Identification
Pick up time parameter
Frequency of pickups
Placing back time
Distance/time
travelled
Visual metrics of how often worker has to leave specified area for procurement of tools
and equipment
UI/Wireframe metrics
Tracking routes of worker
Time travelled
Distance travelled
Frequency
Mapping legends
of value stream digitally.
Cycle time/change over time/lead time/throughput time/uptime/downtime with video analytics
UI/Wireframe metrics
Process start time, stop time
Tool changeover, operator changeover.
SAP integration for extracting procurement, Lead time.
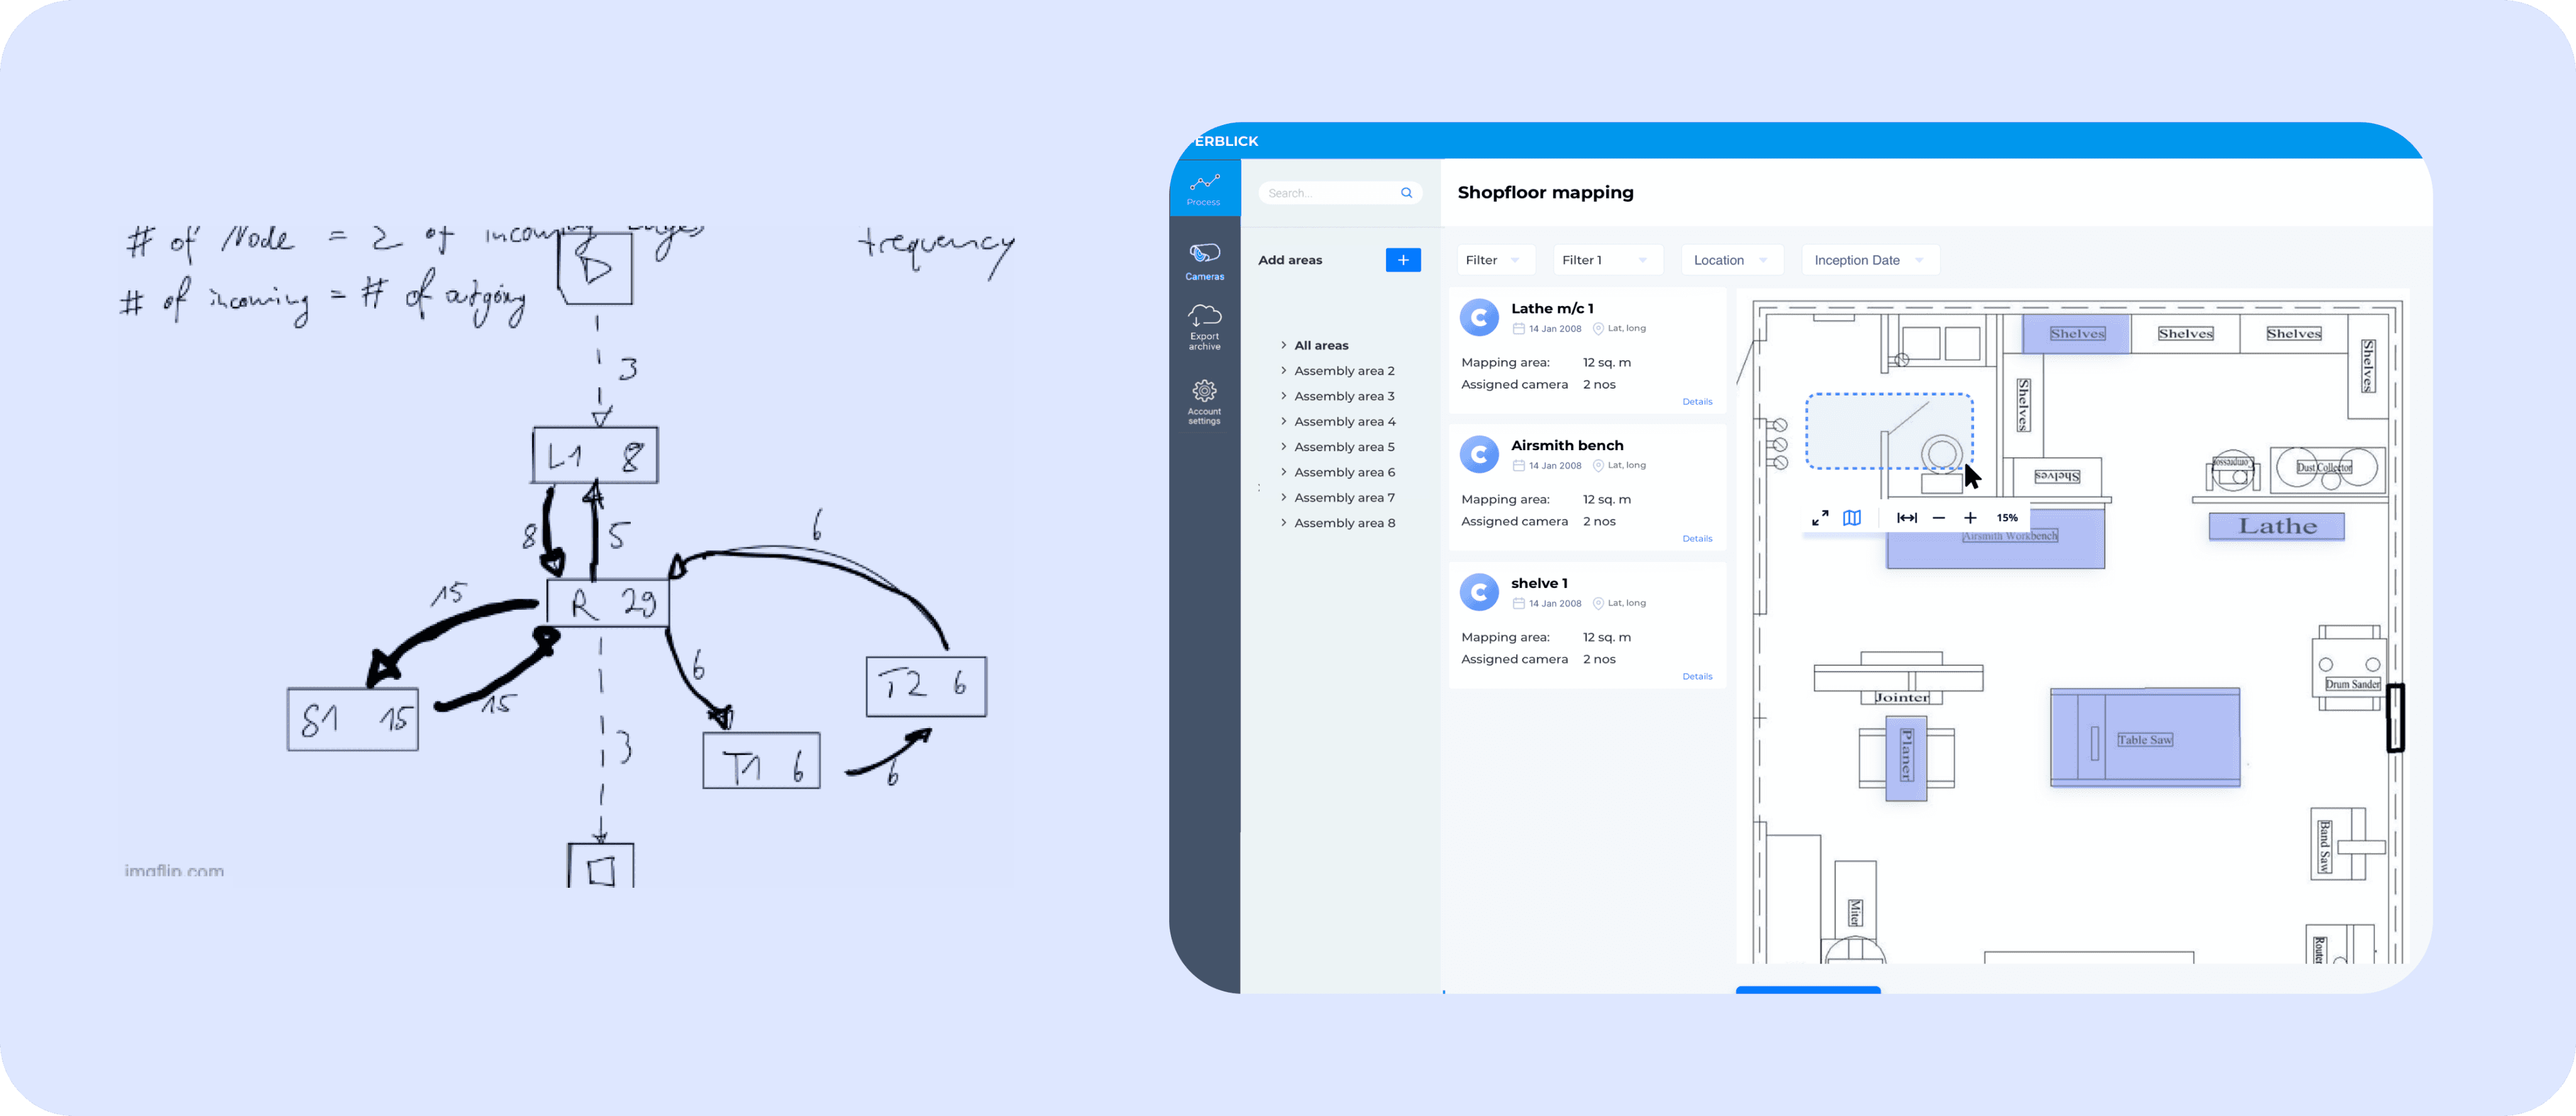
Mapping blueprint of customer shop floor
Identify motion of worker and material/identify efficient work routes
UI/Wireframe metrics
Shop floor drawings,
station statistics.
Spaghetti diagram,
Heat-maps.
Scatter plots.
RTLS activity.
Graphical time and motion sheet to identify and review
monthly and weekly lean activities
UI/Wireframe metrics
Histogram
Check sheets
Job production
balancing
TAKT time
Take machine and operator data to measure overall efficiency.
UI/Wireframe metrics
Integrating third
party OEE
Combine it with Ferblick
motion analysis
Providing efficient and alternative motion paths
to reduce time and motion wastes
UI/Wireframe metrics
AI displaying different
Process maps
By combining, simplifying
& eliminating motions
Product Ideation with AI engineers
Recommendations
How can AI provide targeted suggestions to users?
Training data - Item - item similarity
Suggest item similar to one being looked at.
User - item interaction
Suggest item based on other user behaviour
Similar delay and occurrence in other production lines
Severity of occurrences and detection rate
Recommend user top most critical activity on dashboard based on his/her past search query and interaction data.
Data conversion
AI can get your data in the right format
Training data
Text recognition (OCR)
Speech to text
Transcribe text from audio recording
Tool and equipment trolley can be barcoded or given unique ID so that camera can locate and identify its activities.
Shop floor observations via QA persons can be voice recorded and translated into text in Improvement activities.
Legacy Lean document, process map,BOM can be OCR and fed into the ferblick system to see cumulative % change of motion wastes
Predictive Intelligence
AI can predict the future behaviour of a system
Anomaly detection
Suspect unusual system metric performance
As the ML is trained over many cycle of similar product assembly it Predicts where most delay and error would happen in a new customised product.
Predicts probability of defect in certain tasks of motion.
Predicts Highest defect rates and pin points SOP that are not followed..
Virtual assistants
AI assistants helps interacting in different ways
Chatbot
Example of past conversations, ranking answers
Search Engine
Query / Results pair + Rankings
Lean manager asks chatbot show me most critical motion waste activities today between station R & L1 , on a specified date and time
Chatbot helps user to categorise motion waste as Mura,muda,muri.
Search engine shows most relevant recent searches and number of new activities within them.
Station is searched it shows sub groups category
Creative intelligence
Generate meaningful content of the same types
Training data
Images & text in same domain
Style transfer
Transfer characteristics of certain style to image
Image showing Rearrangement of shopfloor activity / layout
Clicking on different paths shows associated video activity in loop
labelling of Items and pathways in video by training the algorithm.
labelling of Items and pathways in video by training the algorithm.
Object Detection
Infer automatically information hidden in the data
Training data
Image + class + Bounding labels
Entity recognition, Image caption
Labelled text,key phrases | Image captioning
Object, motion, movement, placement of tools, materials & human activity detection
Heat mapping motion activities.
OCR Inputs form manual check sheets, QA/QC tools documents
Input of OEE and MES data for VSM map generation.
Auto Labelling the type of motion the picture as repetitive, relocate, simplify category.
Weekly prototype testing with industry experts and gathering feedbacks
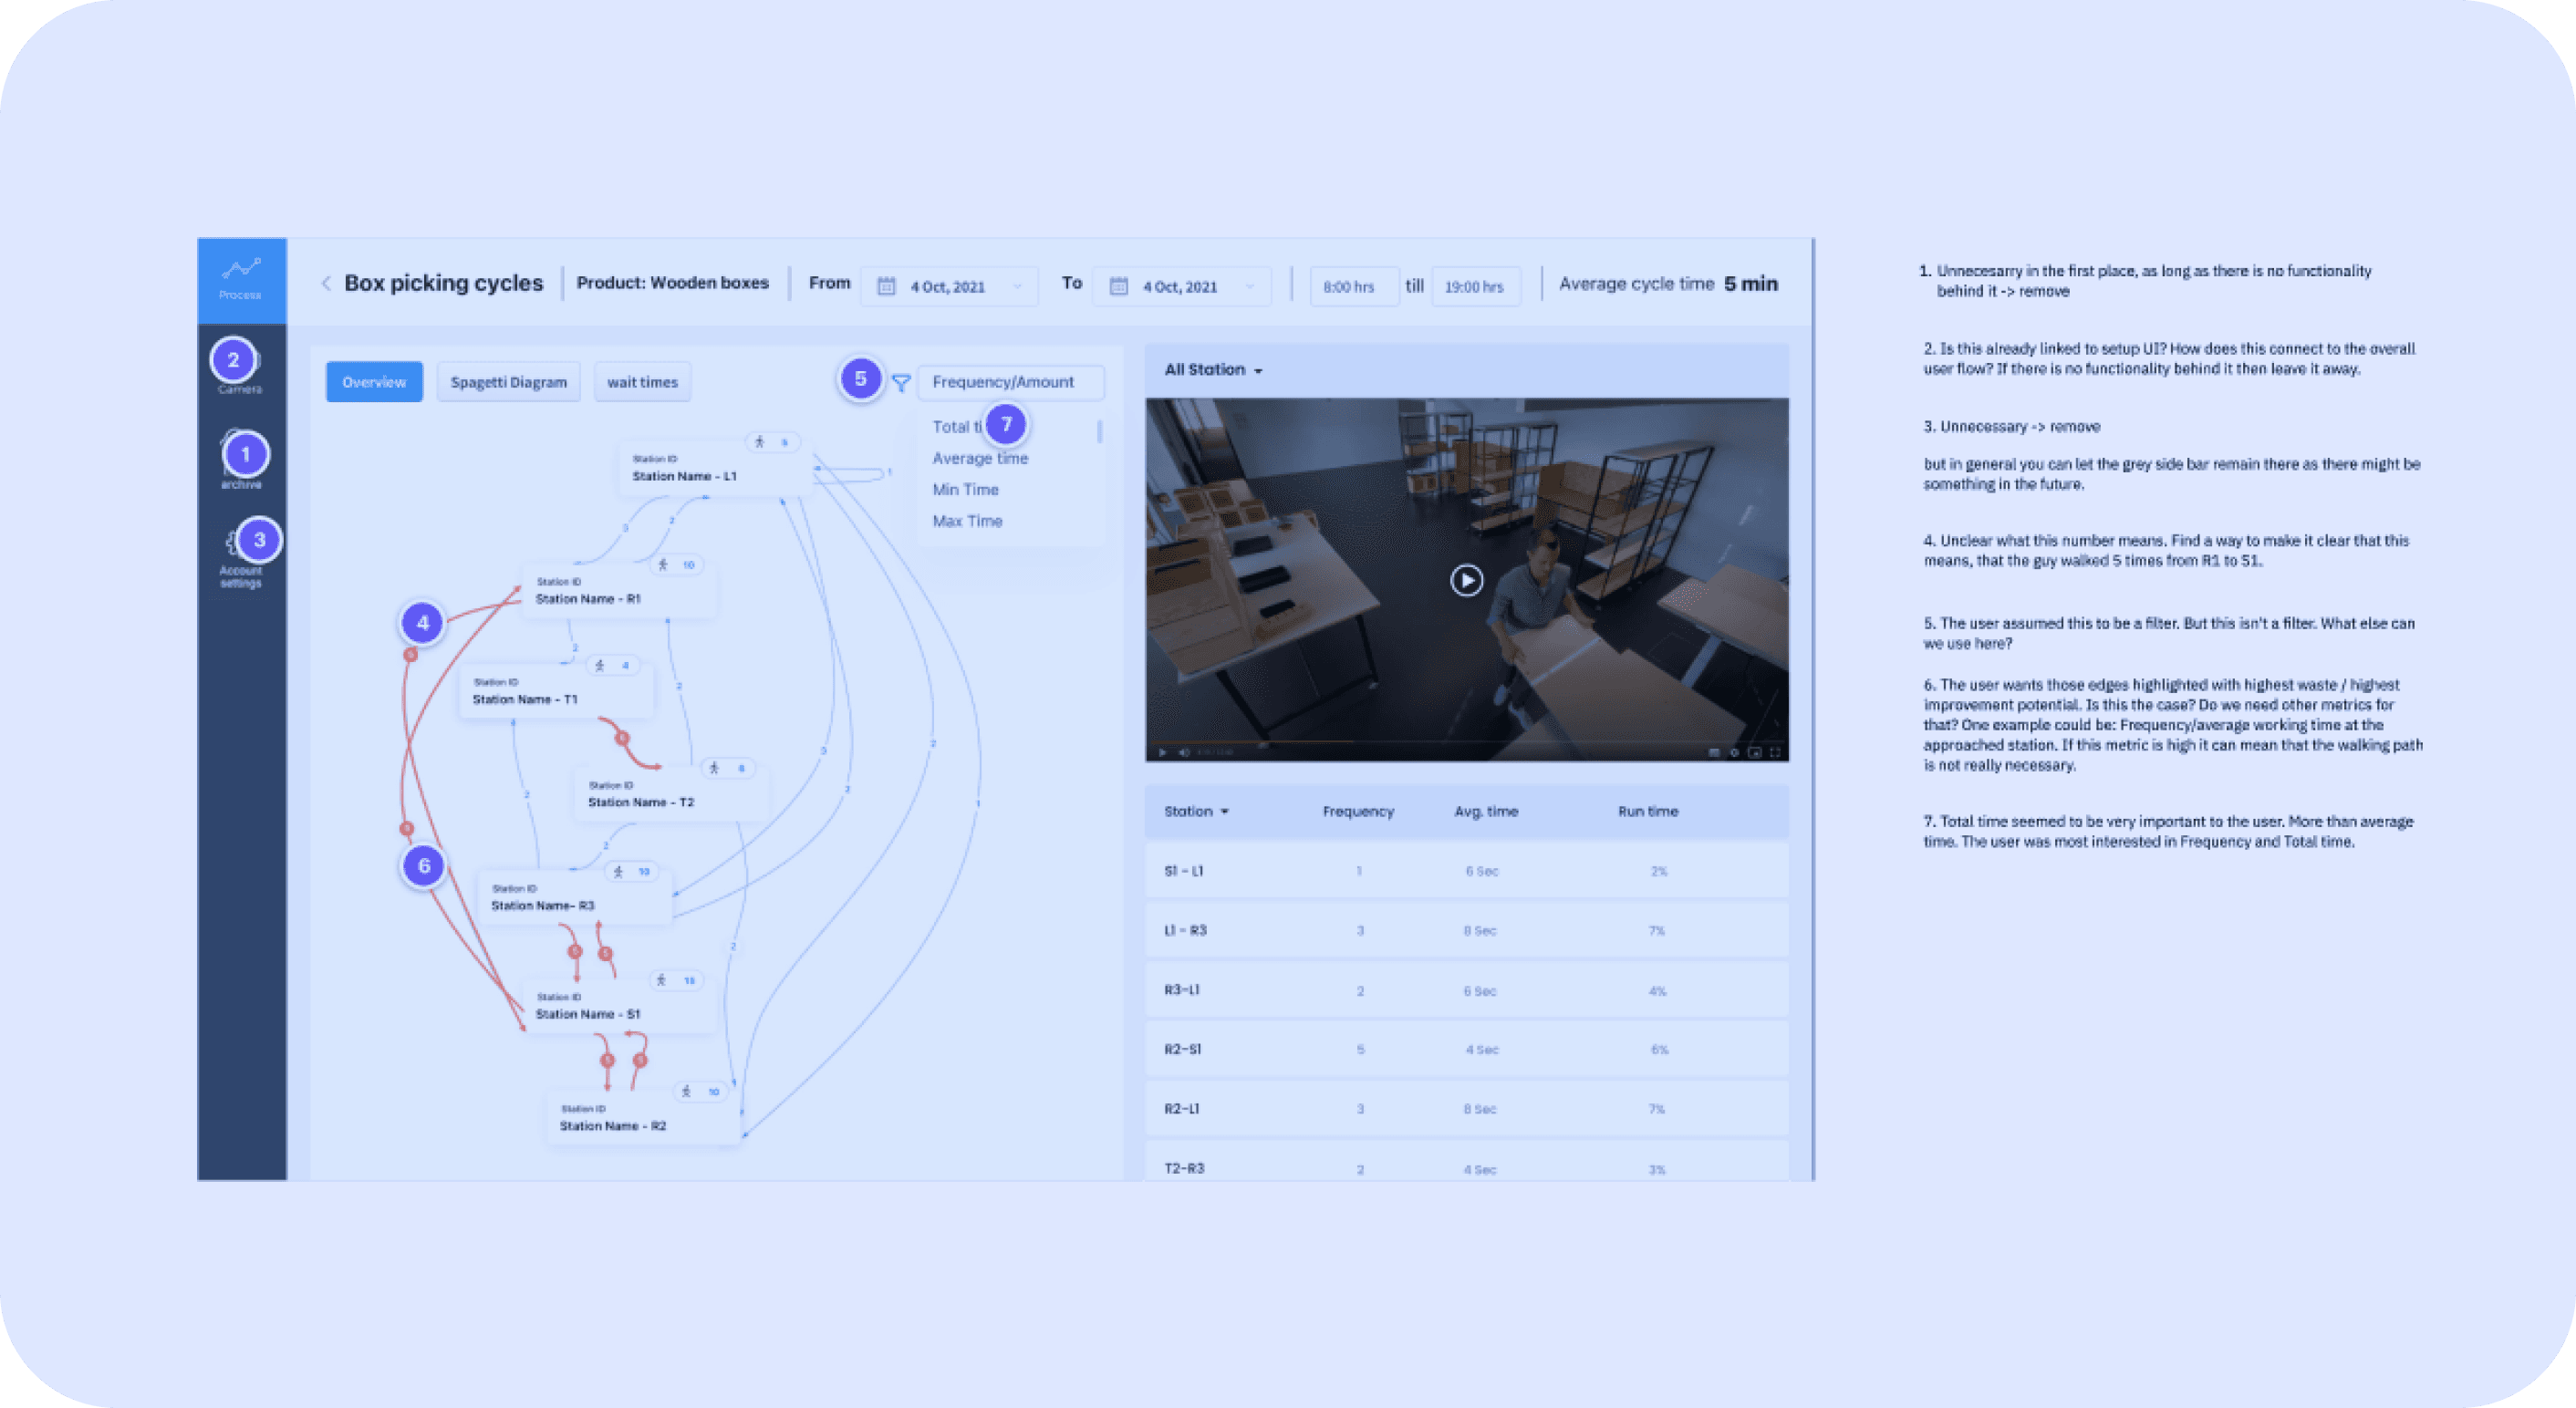
We don’t have a KPI for savings?
Change frequency doesn’t make sense if you just improve one cycle? Must be done for all cycles
Estimated savings should also be shown as big KPI at the Top next to average Cycle time
View Comparison needs clicks Why?
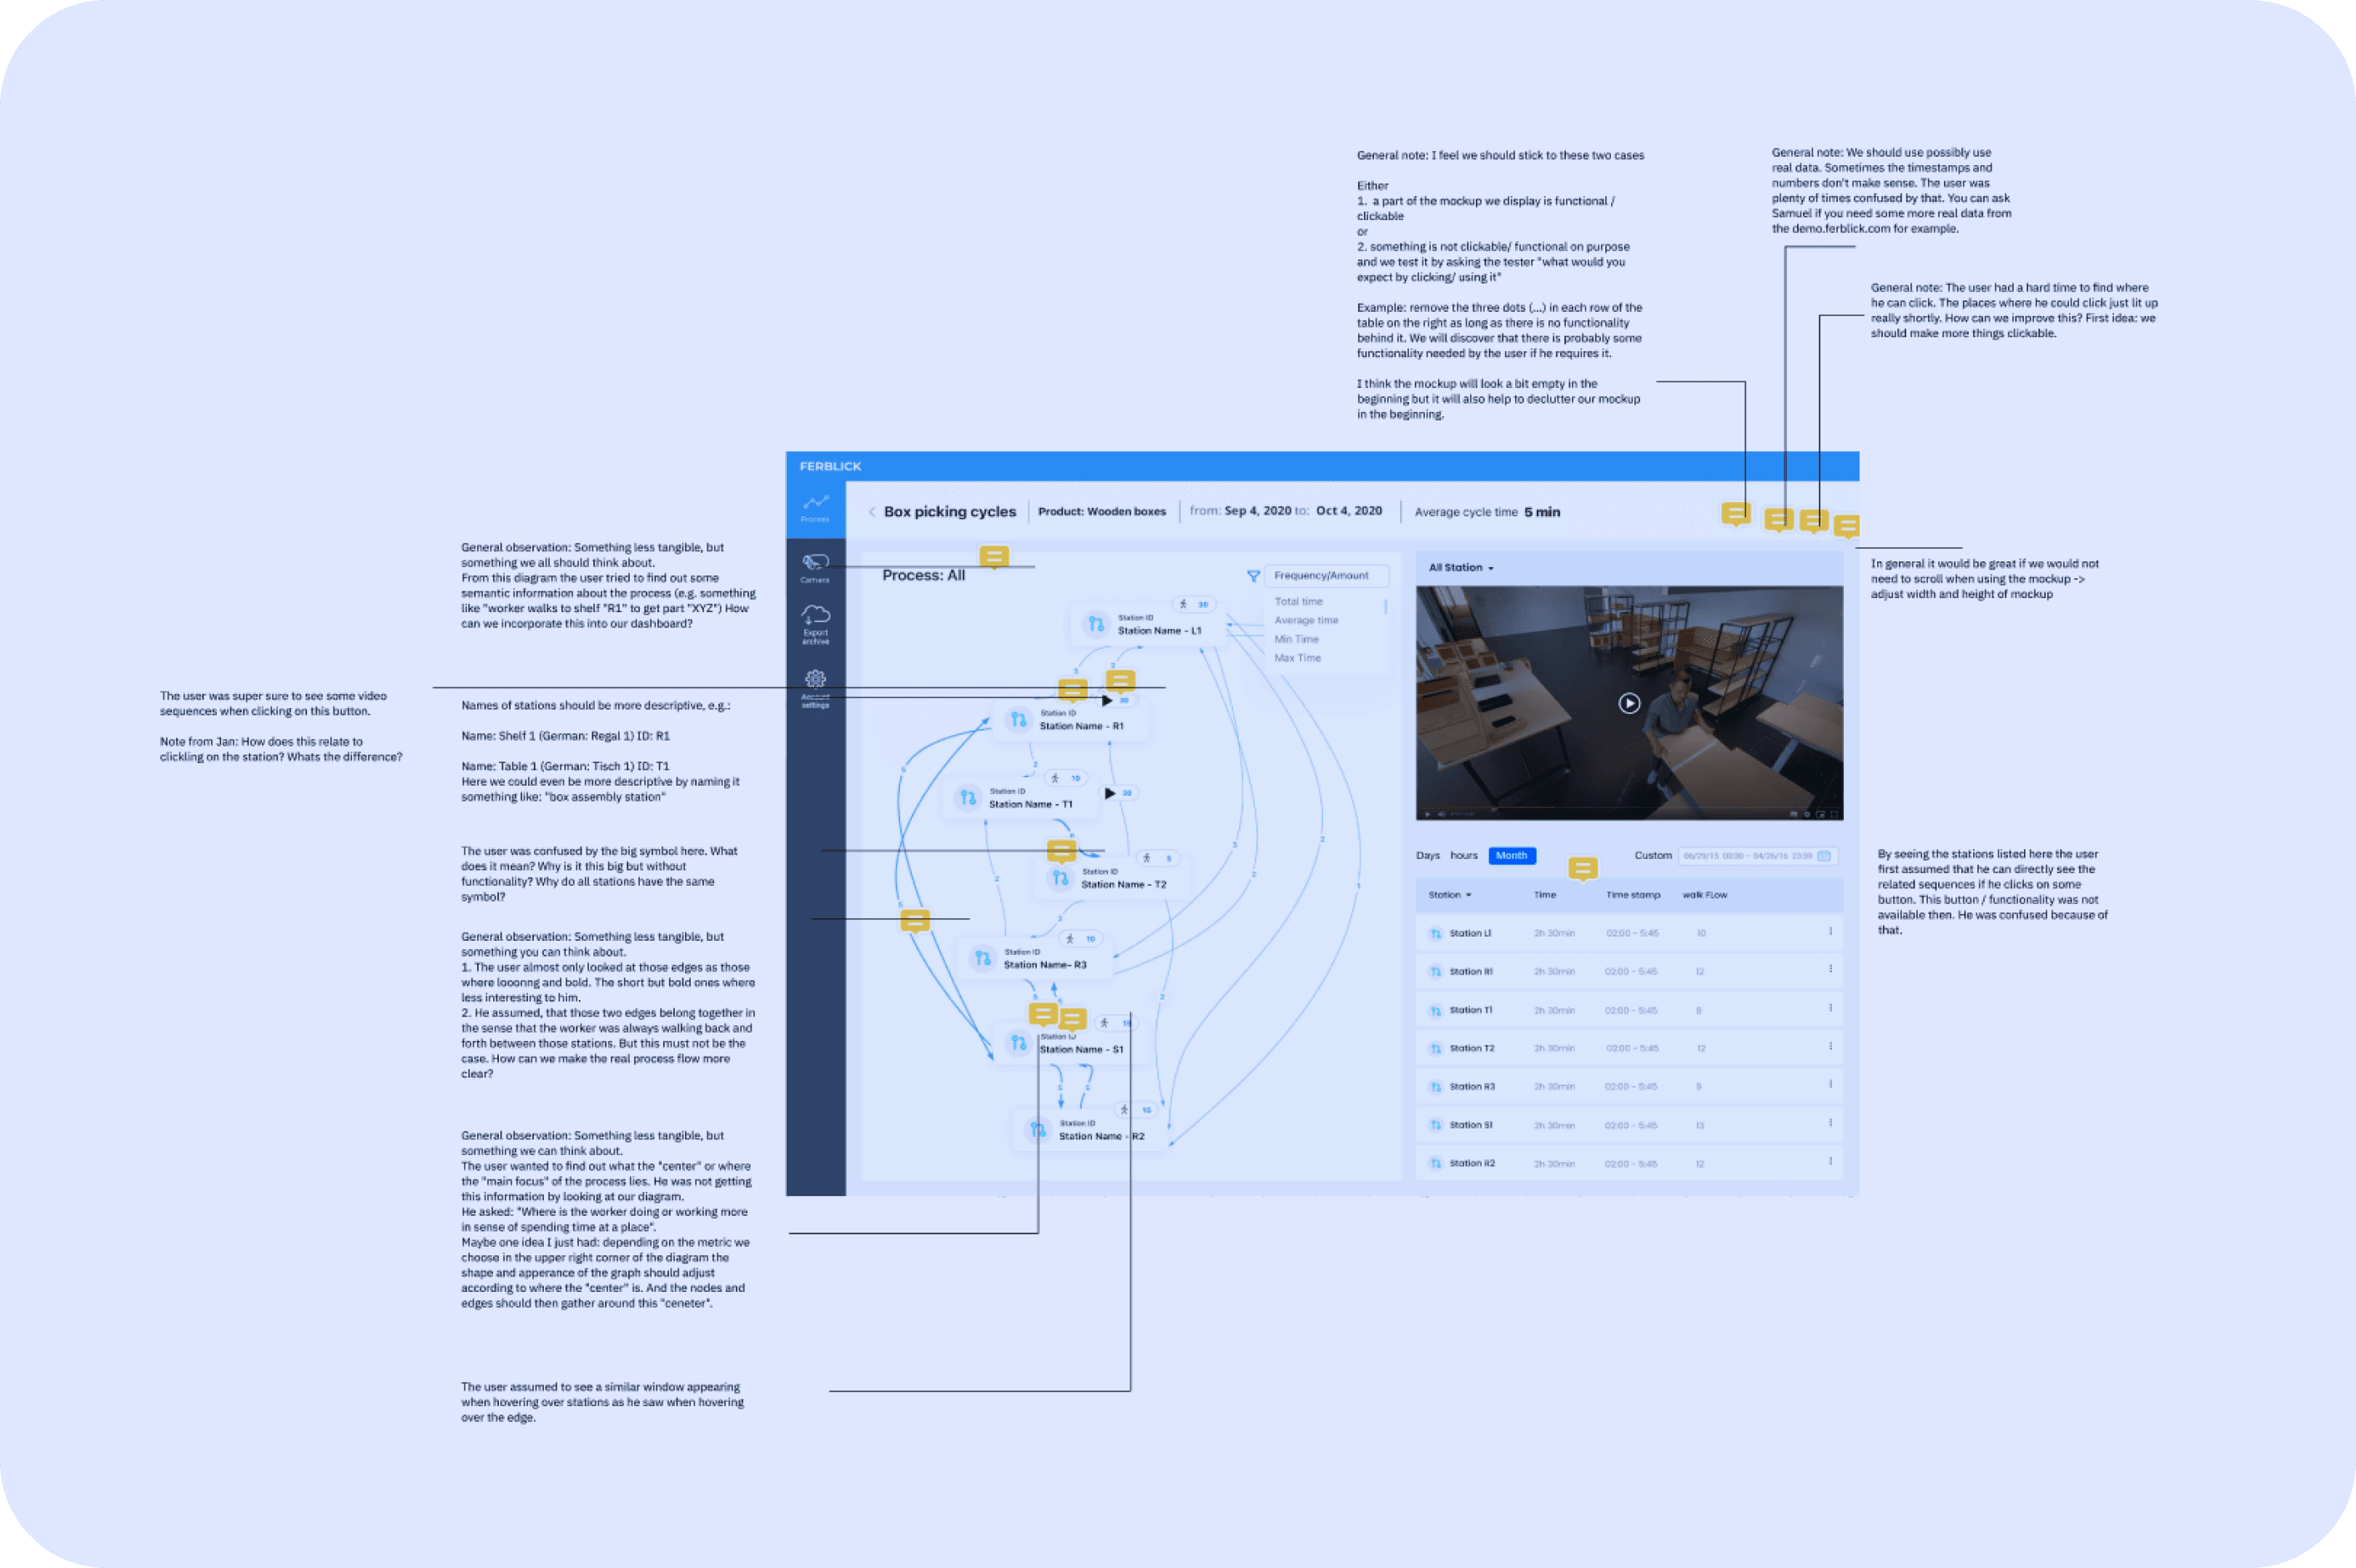
From the diagram the user tried to find out some semantic information about the process (e.g. something like "worker walks to shelf "R1" to get part "XYZ") How can we incorporate this into our dashboard?

User asked: "Where is the worker doing or working more in sense of spending time at a place".
Name: Table 1 (German: Tisch 1) ID: T1
Here we could even be more descriptive by naming it something like: "box assembly station"
Cycle Time does not make. It would be more recognizable if we show the celonis chart where R1,R2,R3 is grouped into R.
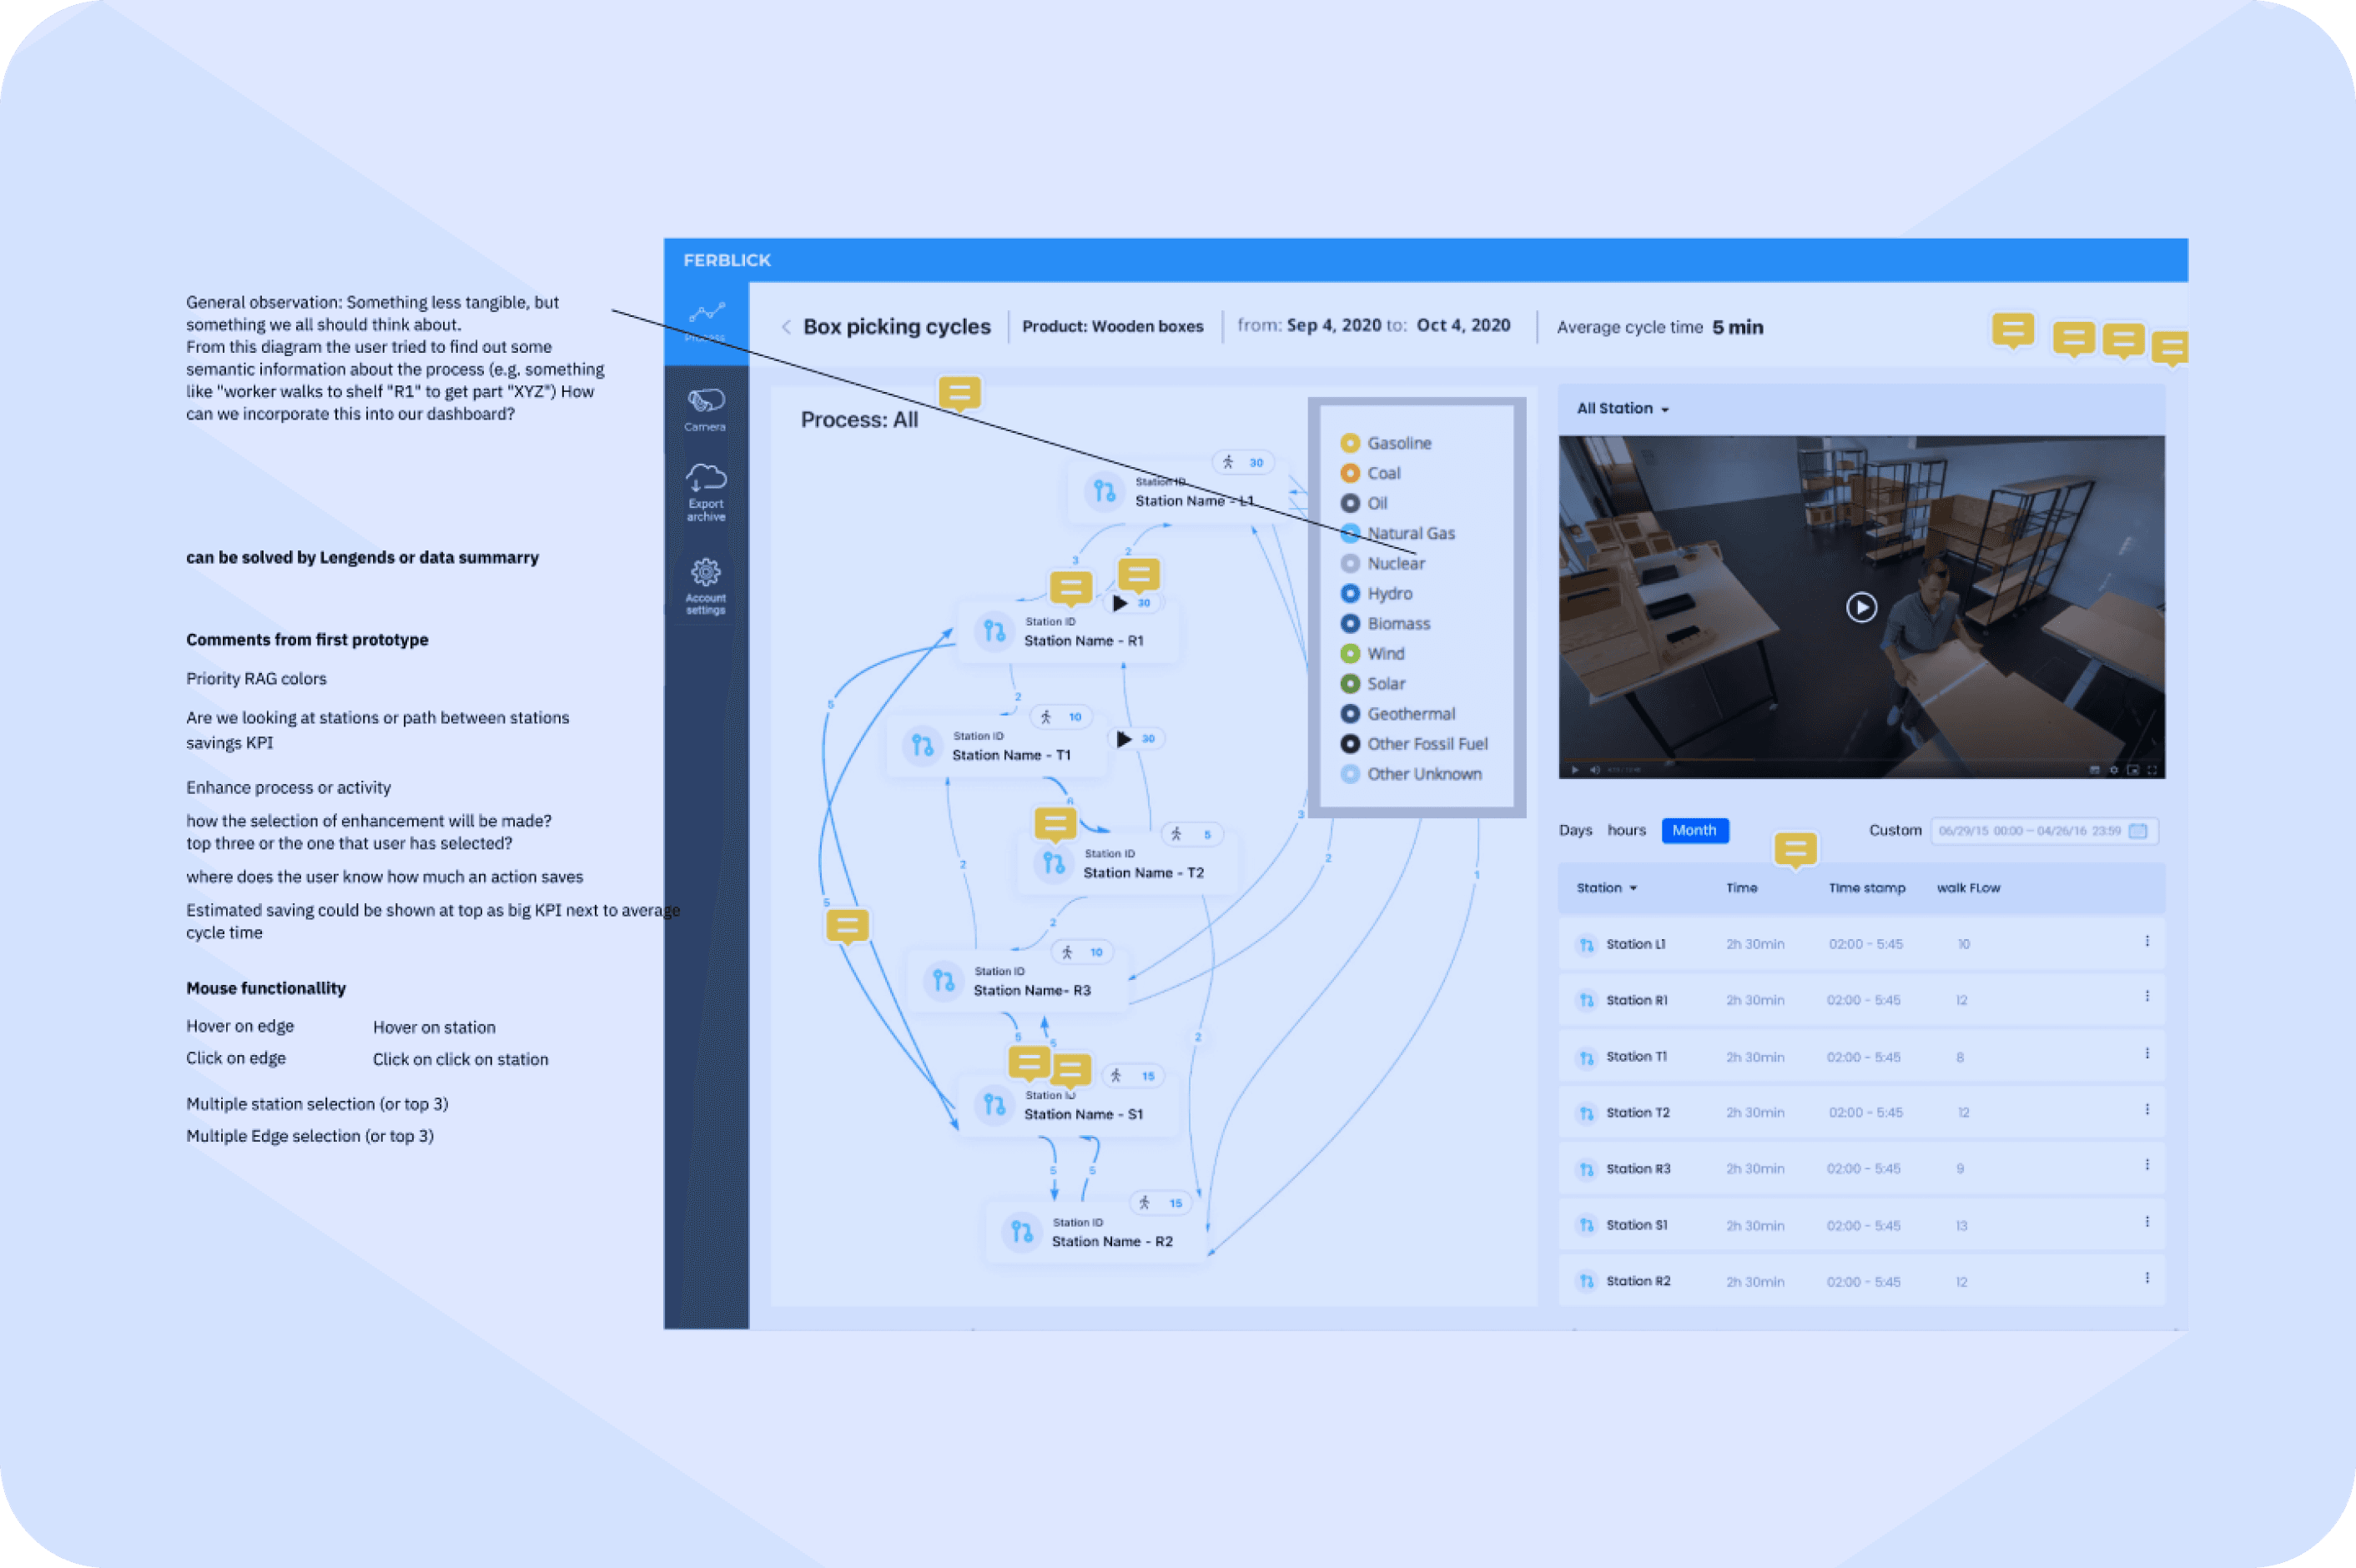
cycle time should not be a "overall / global" KPI in our app
Find a way to make it clear that this means, that the guy walked 5 times from R1 to S1.
The word "cycles" was misleading. Maybe change it to something like 5 times or 5x walking... or something even more suitable
User had the intention to click on this. Word "Flow" was misleading. Maybe "walking from R1 to S1" is enough.
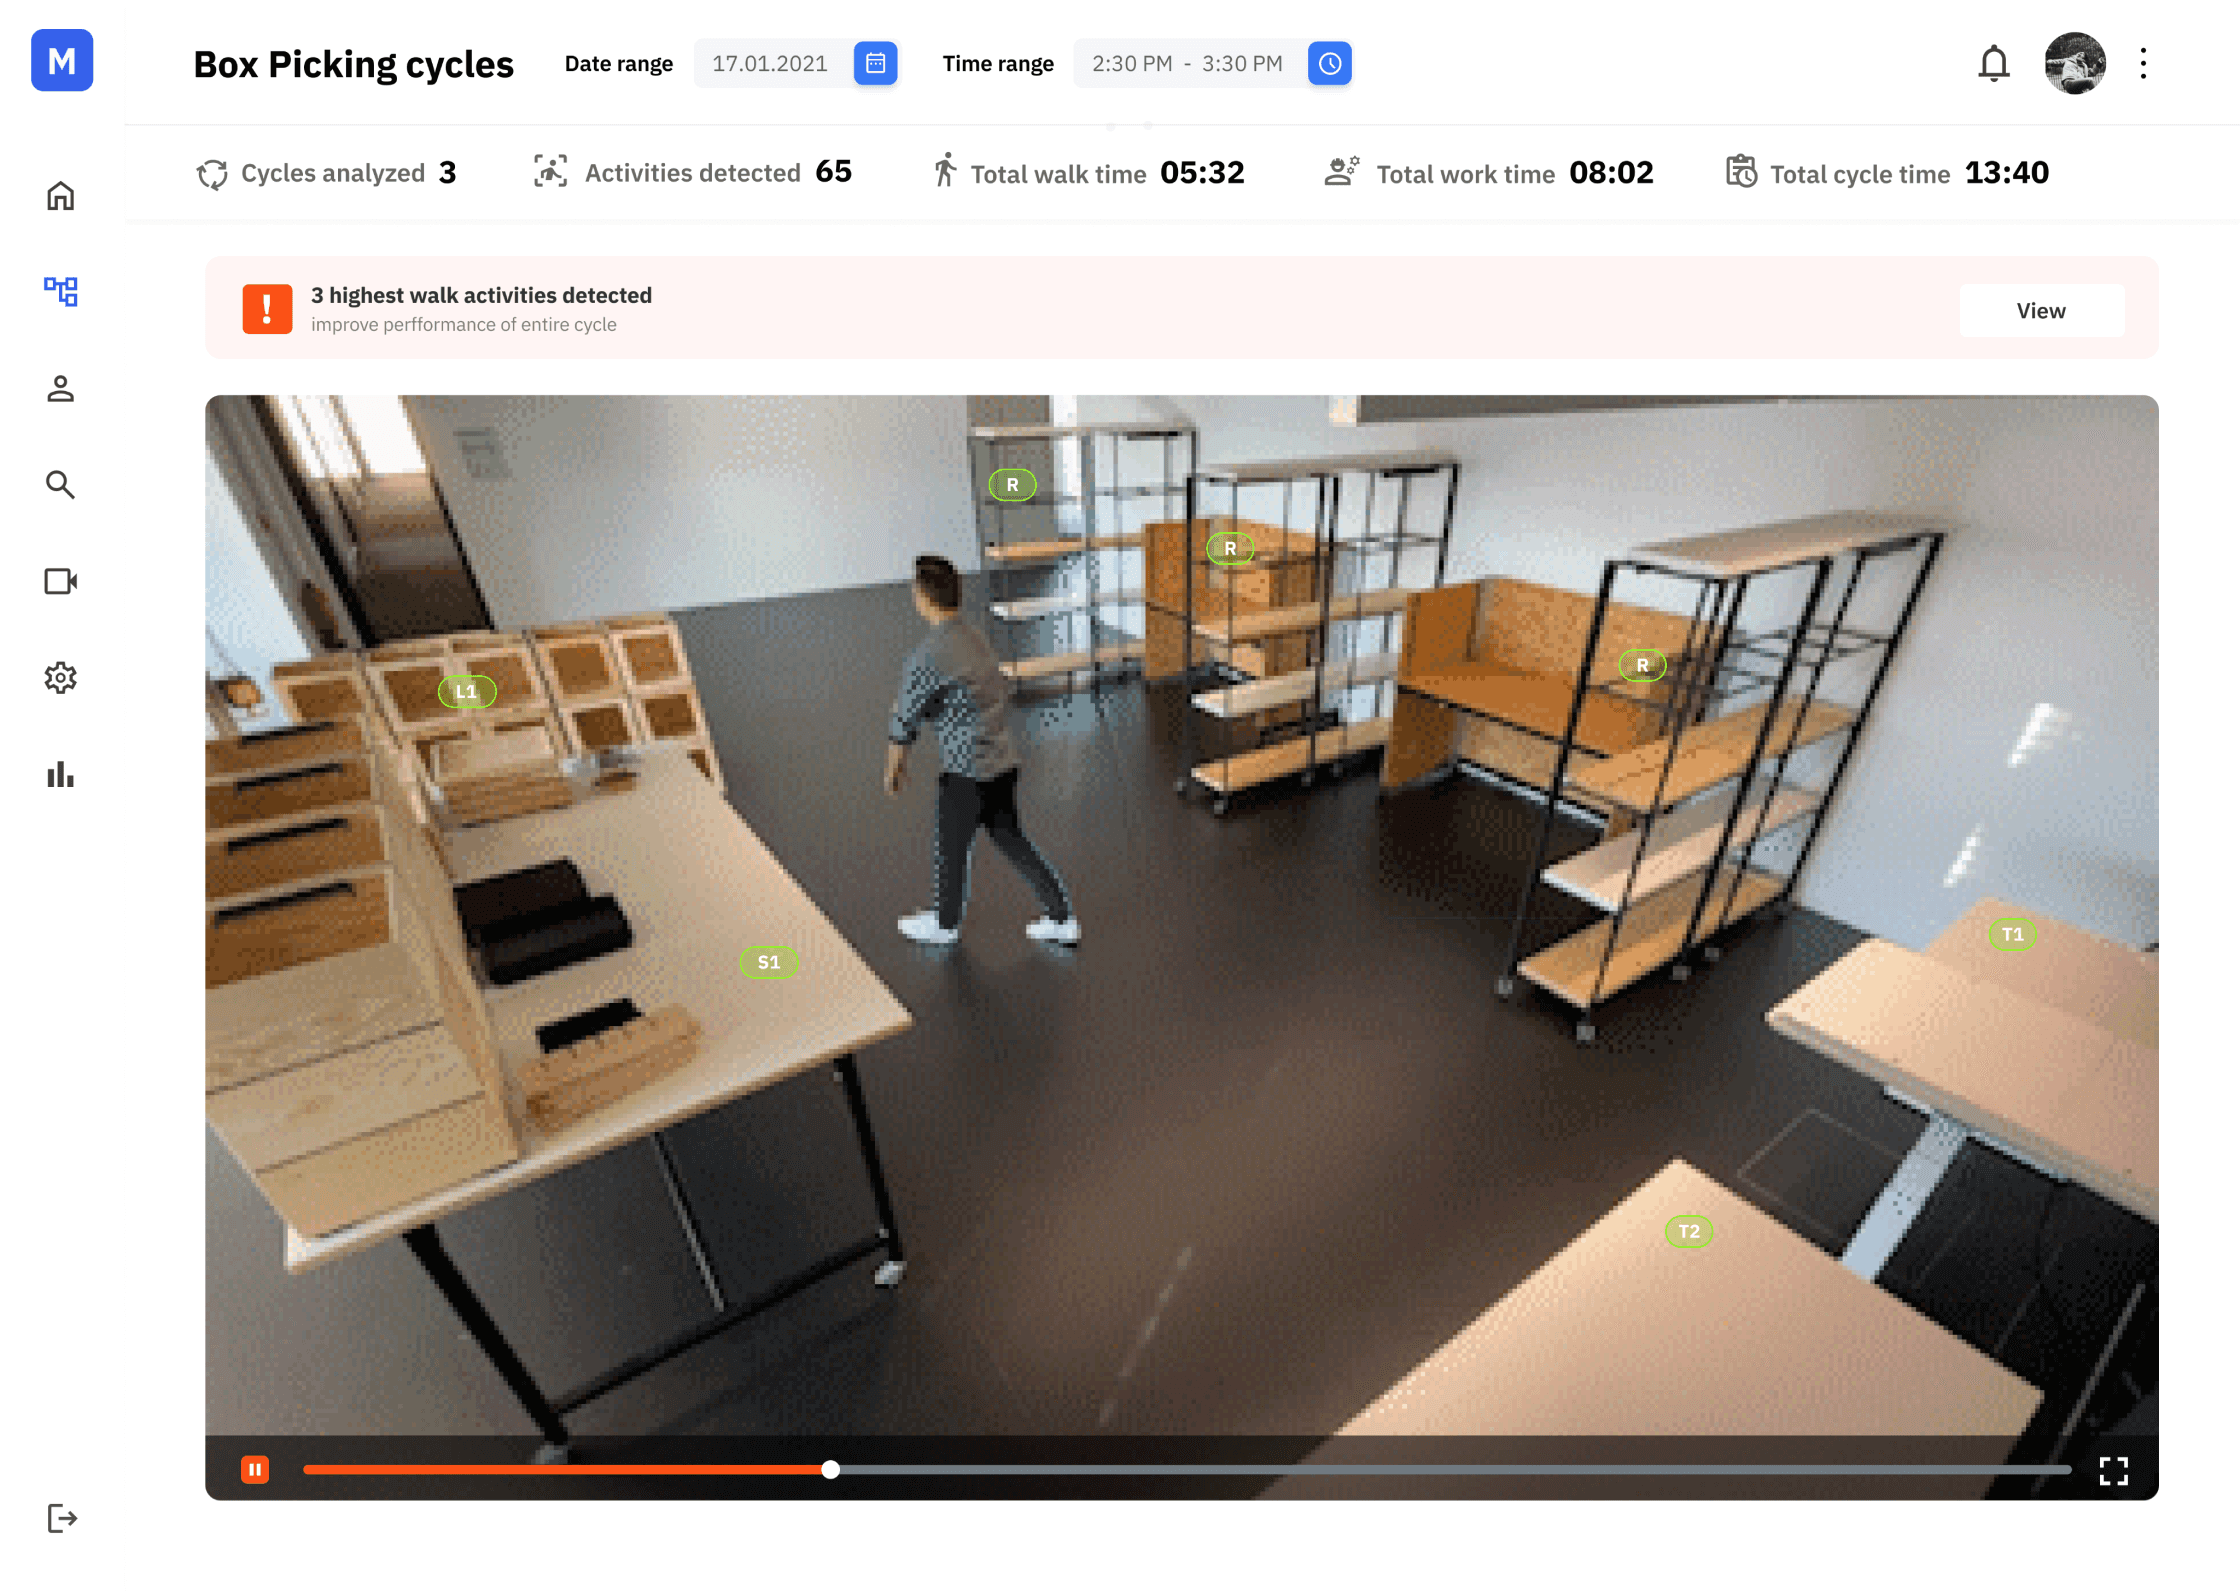
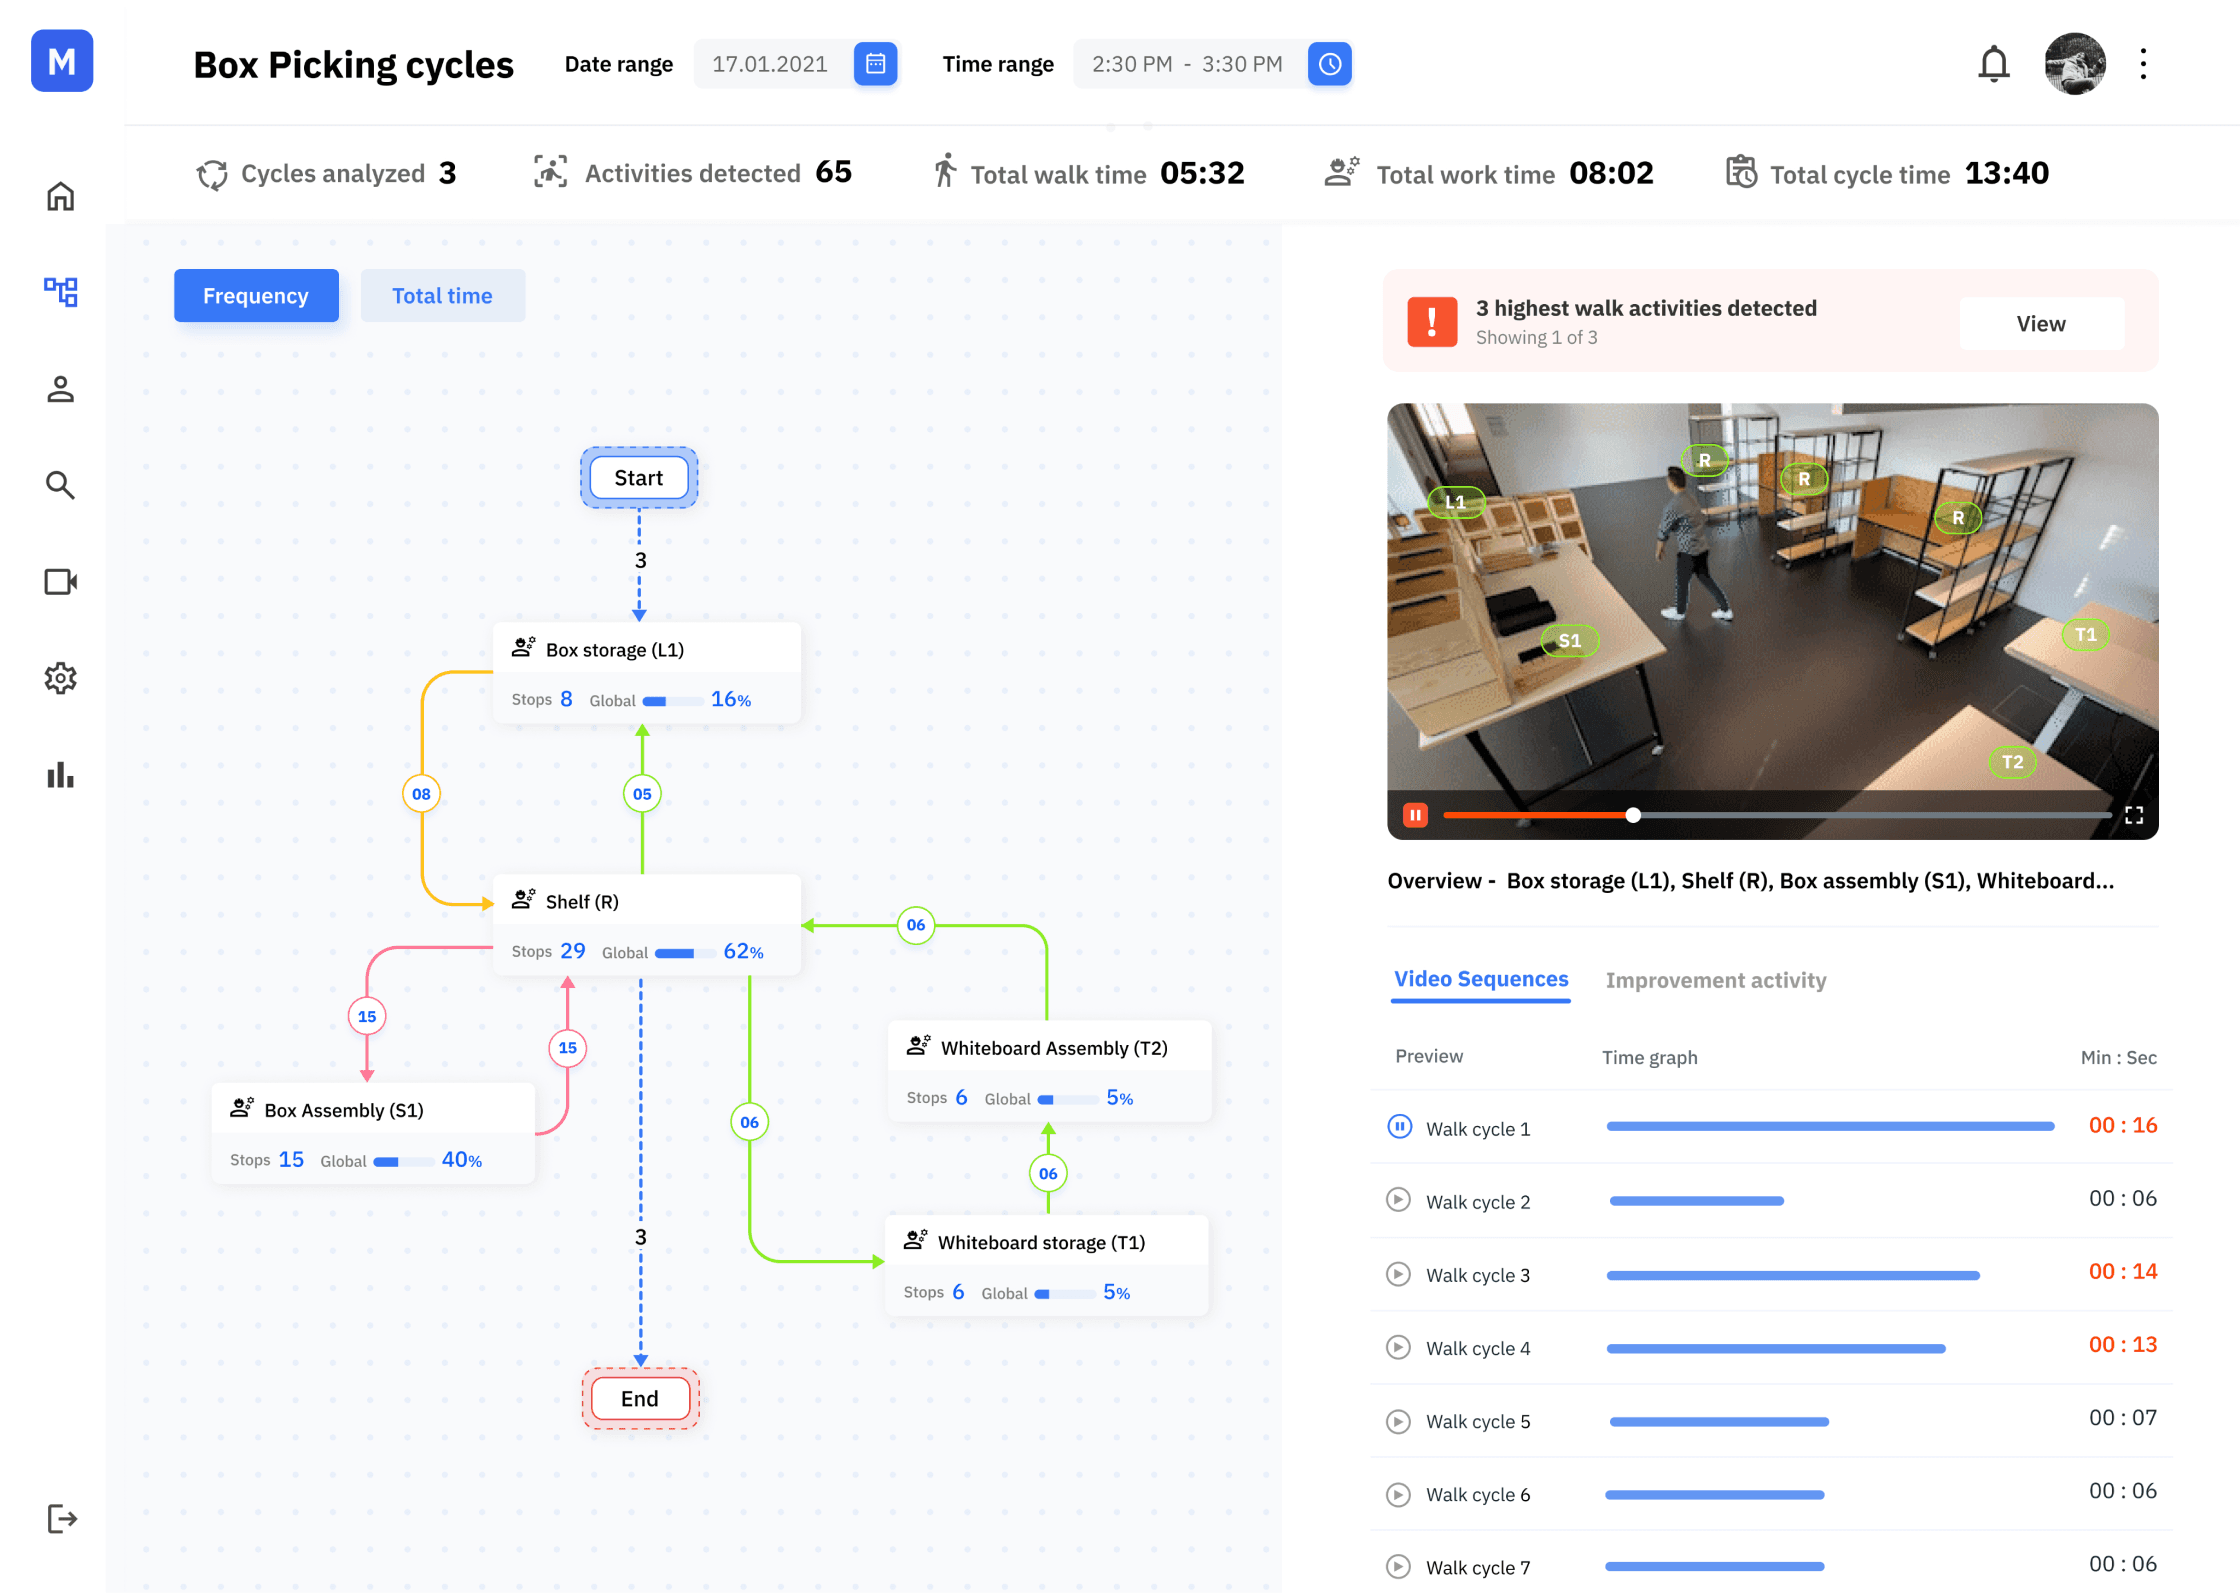
Product understanding & content demo for customers
Intermediate product flow and demo based on all iteration, insights & interviews
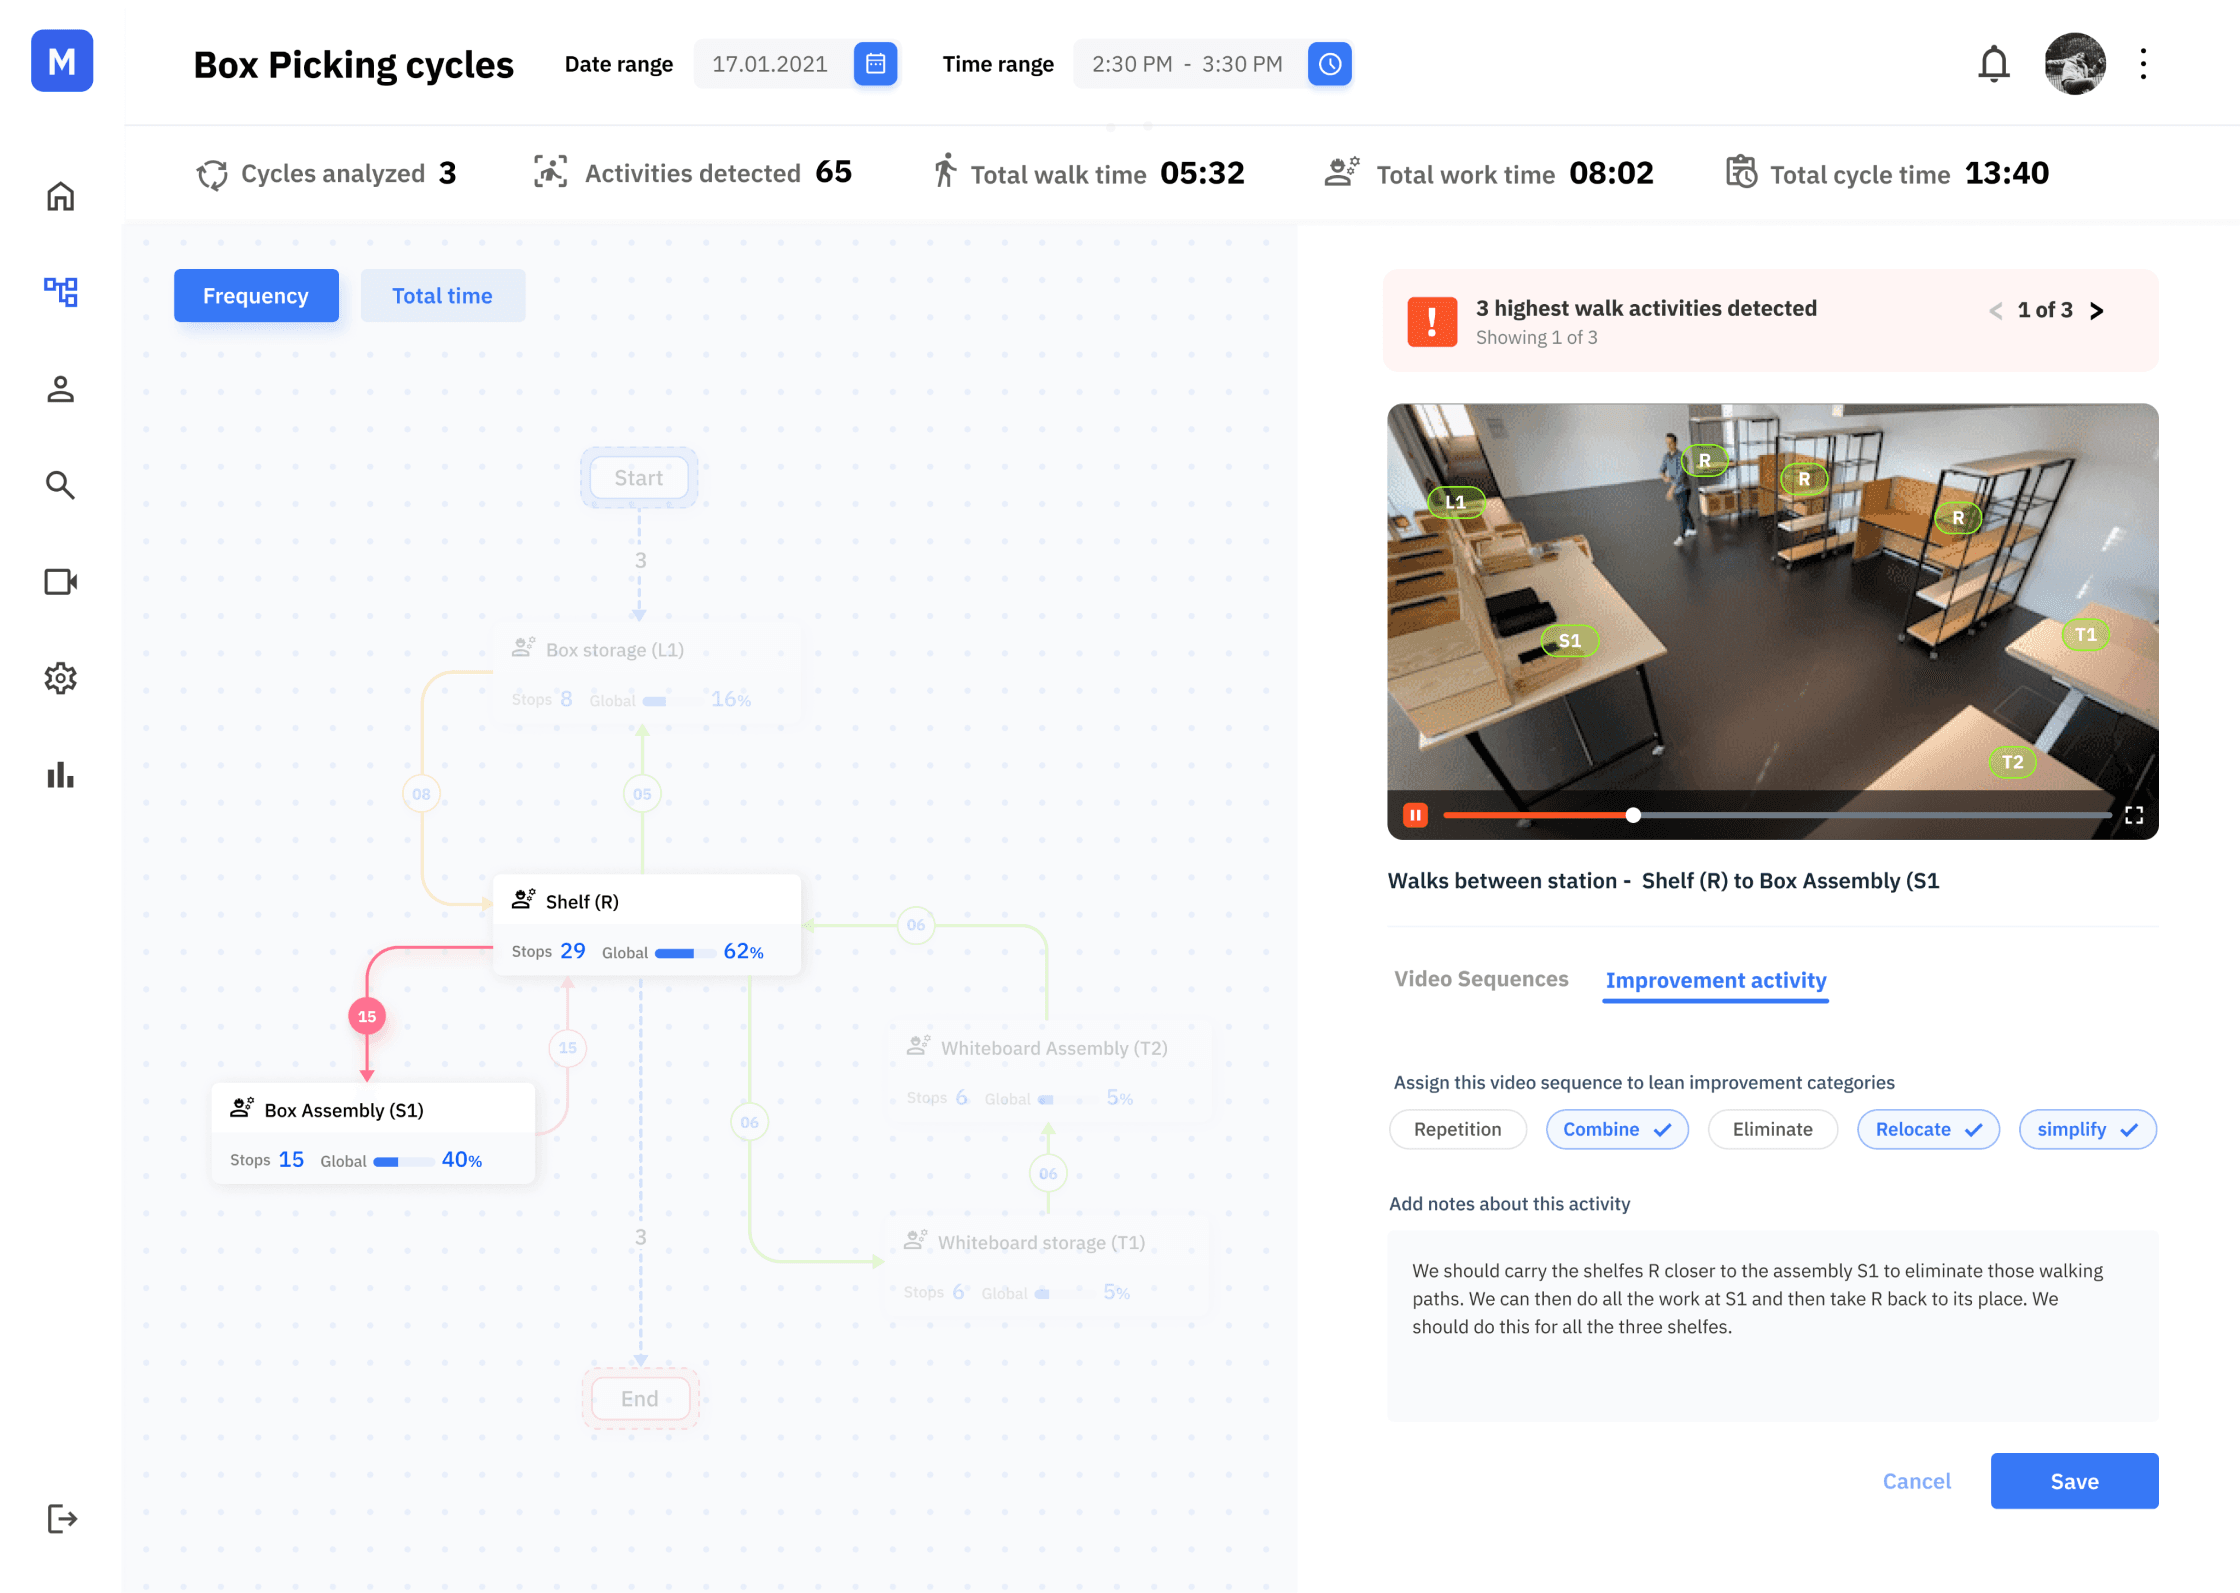
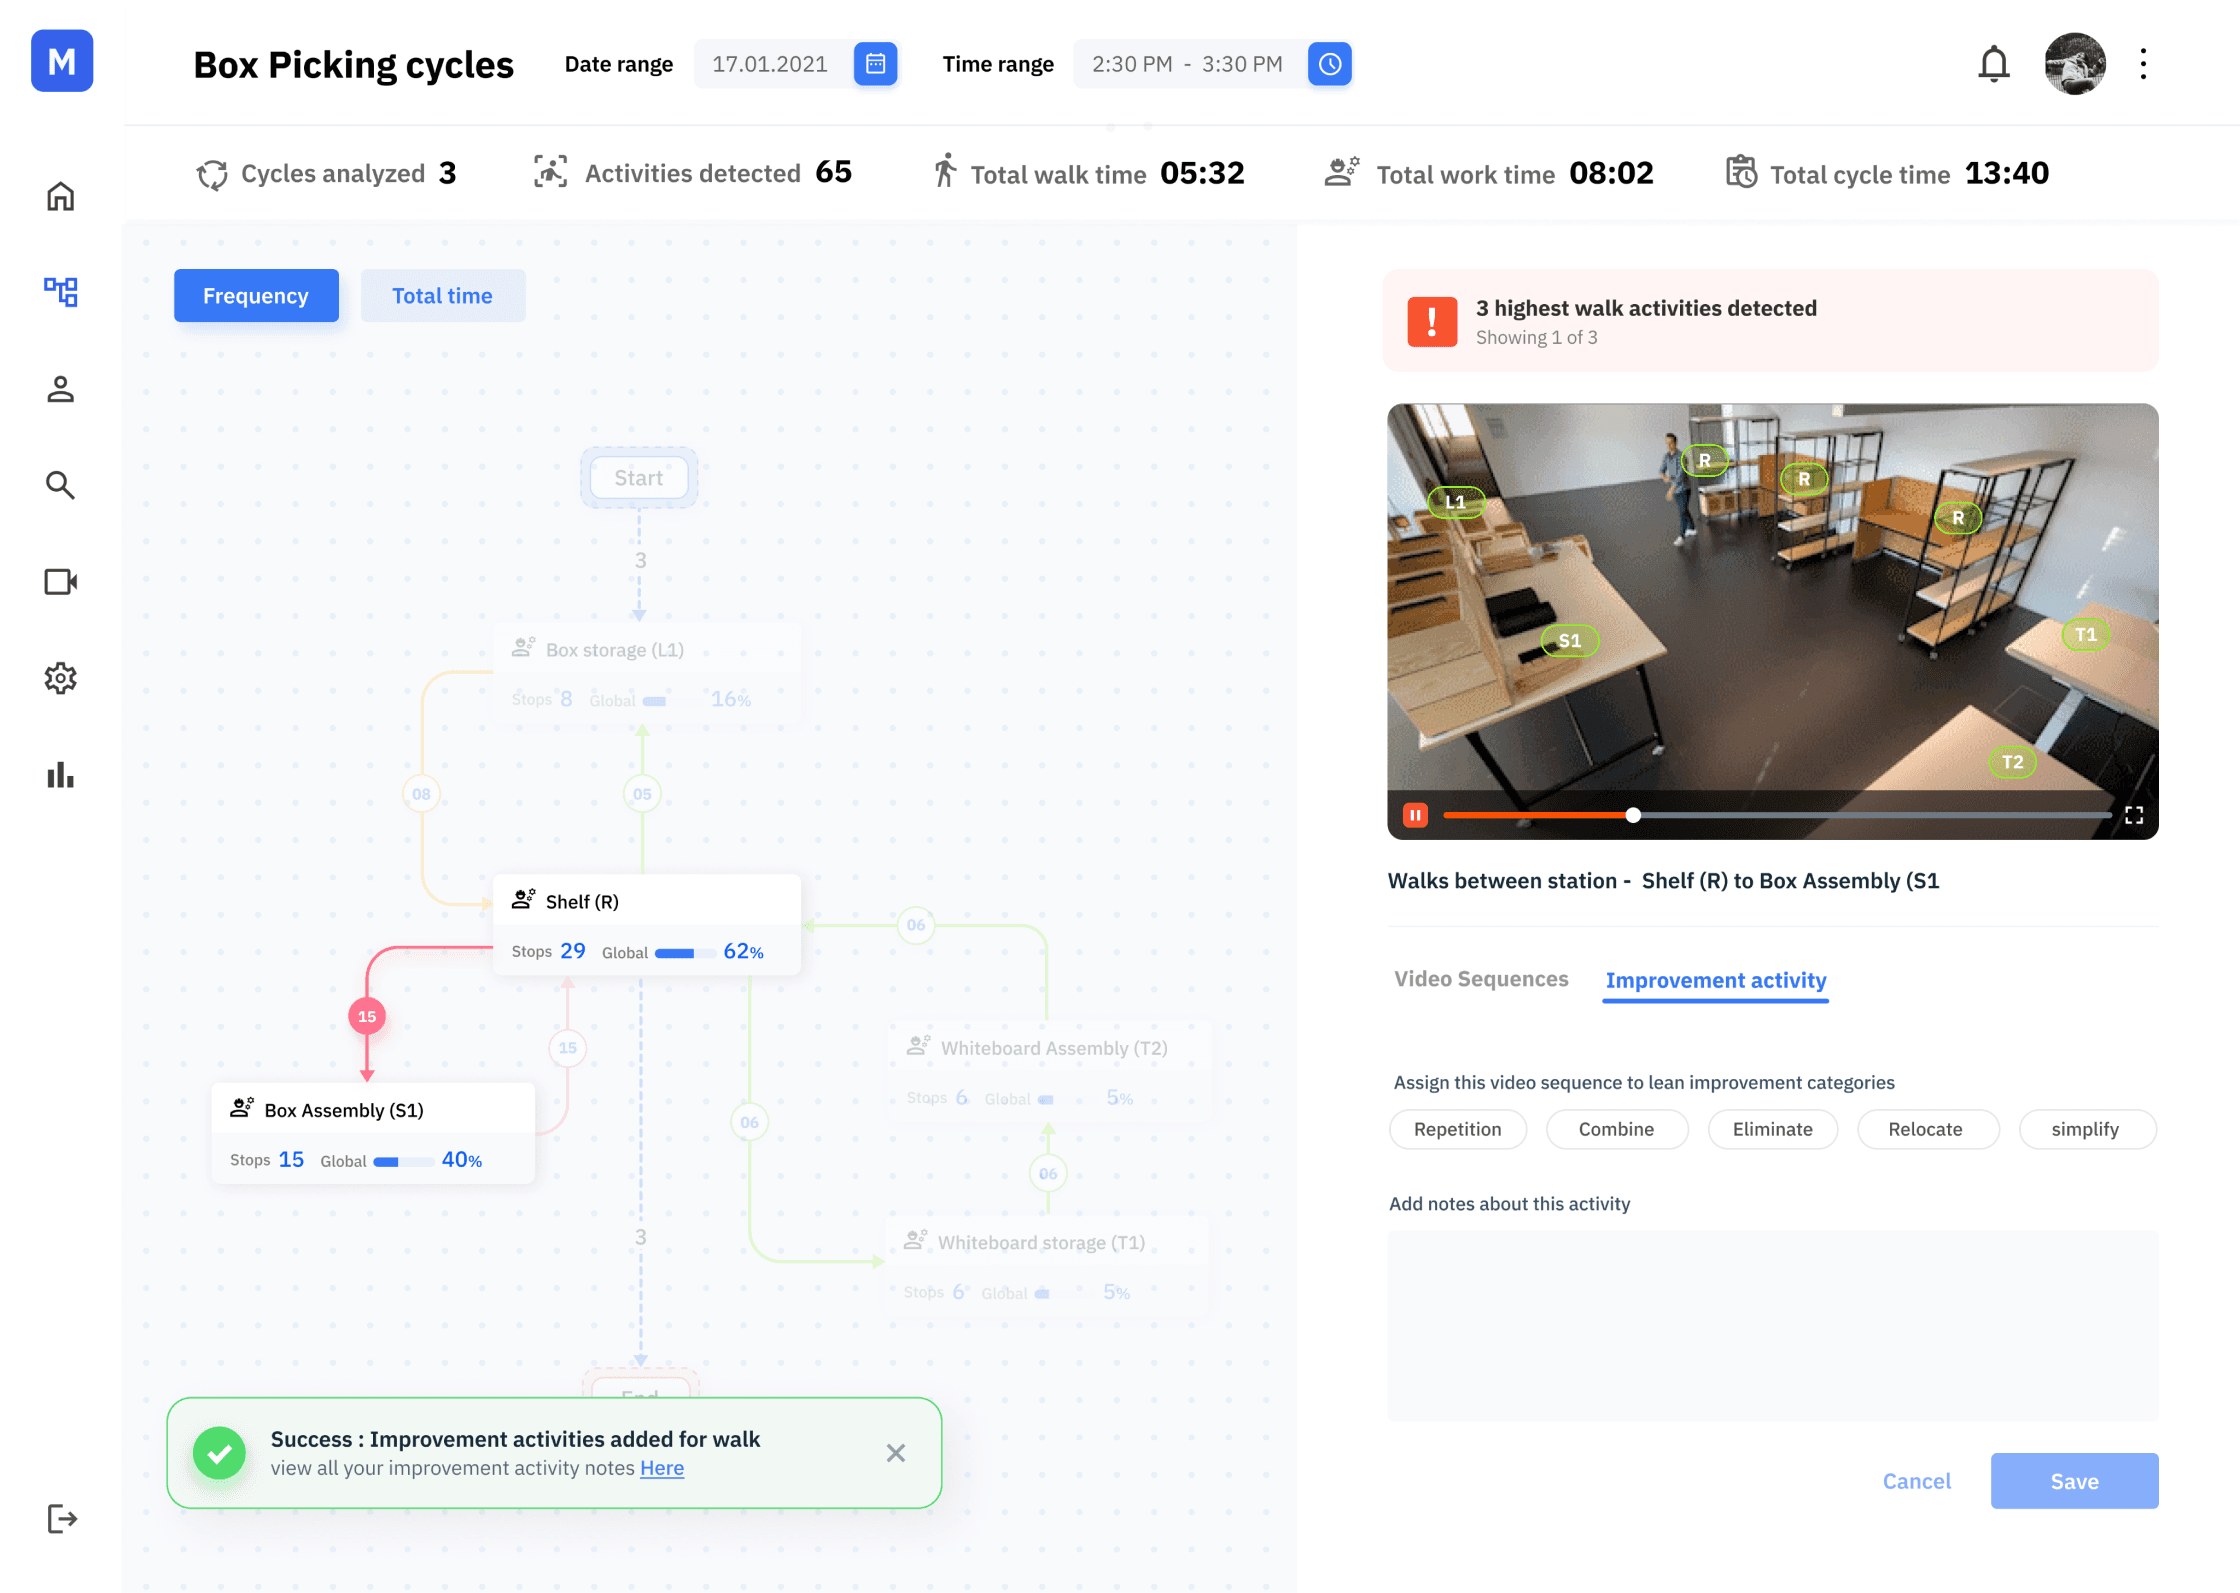
Key interaction screens from final product flow

Industry 4.0
A.I lean management
With help of cameras and intelligence: errors defects and delays are prevented. Which reduces the throughput production time and increases efficiency
Company
Ferblick Gmbh
Role
UX Research
UI & UX Design
Industries
Manufacturing
Date
Jan 2022
What is vision
analytics for industry?
With help of cameras and intelligence analytics following inefficieny in Manufacturing areas are detected:
Motion waste
Delays are prevented.
Errors defects
Reduces the throughput production time
Increases OLE & OEE efficiency
The Product & UX goal question?
Wouldn't it be great if AI could Identify and reduce the unproductive tasks /actions of human operators in manufacturing unit, to help increase production efficiency
“
“