About this case study
Conducting thorough research to understand the landscape, pinpointing potential challenges, proposing effective solutions, and implementing UX principles and guidelines through thoughtful visual design.
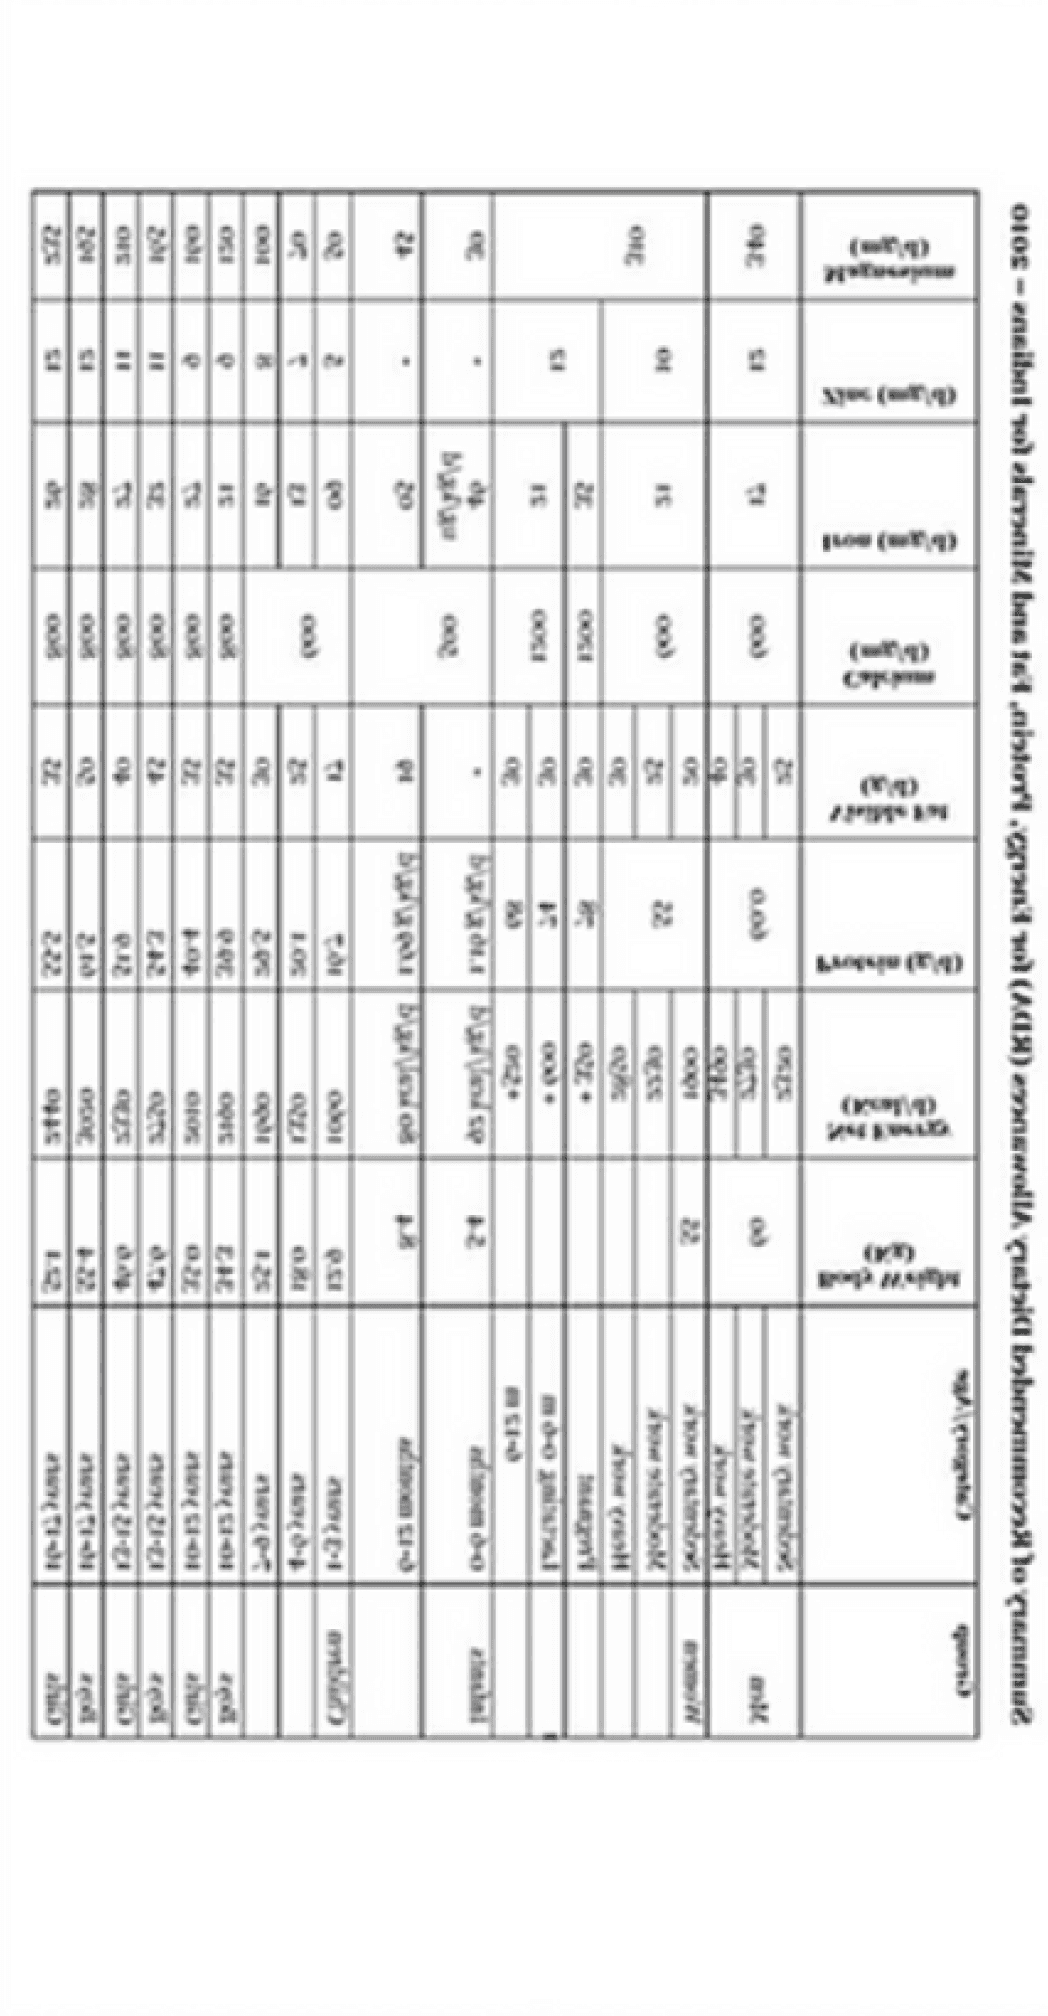
Indians on average eat more carbohydrates, less protein and less fruit and vegetables than newly published dietary recommendations by The Lancet.
Quantities not mentioned for some categories as data for some individual components was in terms of number of packets/cups etc.
Daily Intake (g)
Daily calorific (kcal)
Recommended
Rural
Urban
432
1318
282
850
347
1058
194
269
459
879
242
335
94
204
140
208
450
272
26
103
31
120
29
114
carbohydrate sources
(0-60% of energy)
Protein
(around 15% energy)
Fruits, veggies
Added fats
All sweeteners

whole grains
Starchy vegetables
beef or lamb
Pork
Poultry
Eggs
Fish
beans, lentils or peas
Soy foods (dry)
Peanuts
Tree nuts
Dairy
Vegetables
Fruits
Palm oil
Unsaturated oils*
Dairy fats
All sweeteners
232
50
7
7
29
13
28
50
25
25
25
250
300
200
6.8
40
0
31 (0-31)
366
66
3
0
6
4
9
24
0
2
1
145
160
50
1
22
1
26
293
54
5
0
8
7
8
27
0
3
1
183
174
100
1
28
2
29
Recommended (Kcal)
Rural (Kcal)
Urban (Kcal)
Indians consume between 200 and 300 Kcal every day of foods that the commission says are harmful for individual and planet health. This includes junk food and eating out.
Daily calorific intake (Kcal)
Rural India
Urban India
Cereal products
Pulses products
Alcohol (ml)
Junk food
Eating out
Non alc. beverages
35
54
8
12
3
1
28
54
133
140
04
08
211
269
Junk & Eating street food

Possible factors affecting Indian's eating behaviour:
Unbalanced meals intake
Lack of dietary education
The rise in disposable income
Insufficient knowledge of serving size
Unreliable information overload
Diseases caused by unhealthy lifestyle:
Heart diseases - 28.1% of total deaths in India in 2016
Stroke - 7.1% of total deaths in India in 2016
Diabetes T2 - BMI has the highest impact
Heart diseases, Stroke and Diabetes T2 are among the top 10 death causes in 2017.
Nutrient Knowledge Patterns: Insights from a 56-Participant Online Survey
Prilimilary survey results (Attitudinal Research)
A thorough online survey was conducted on a mixed sample of 56 participants to know about their nutrient knowledge in general.
78.6% people said they consider 'Quality' while buying fruits & vegetables. One reason could be because there is no information regarding available nutrients at the selling points.
Around 67.9% people said they 'checkout the variety' in the store then decide which fruits & vegetables to buy. This might be happening because of their lack of knowledge about nutrients present in the F&Vs.
A large proportion of people buy branded food & snacks also when they go out to buy fruits & vegetables. Possibly because of their rise in income, wish for a western lifestyle and branding of packaged food as "natural".
Paying for Health: Willingness of Consumers to Invest in Nutrition
Global market intelligence agency “Mintel” insights - Half (48%) of consumers in India aim to live a healthier lifestyle.
Consumer Lifestyle Priorities in India:
48% aim for a healthier lifestyle.
30% prioritize better time management.
25% focus on improving relationships with family and friends.
24% aspire to travel.
Willingness to Pay for Nutritious Snacks:
39% of Indian snackers are willing to pay extra for fruit and vegetable snacks.
Natural Food Product Launches in India (2012-2016):
India had the highest number of natural claim food product launches in Asia.
The fifth-largest market globally for natural food launches.
Contributed to 6% of the world’s food launches labeled as ‘natural.’
Essentials of Nutrition: (RDA) Recommended Dietary Allowance for Health.
While studying about achieving good nutrition, I stumbled upon this term 'RDA' which basically means an estimated amount of a nutrient (or calories) per day considered necessary for the maintenance of good health.
An important thing to note here is that this applies only for healthy people who are free from any special conditions.
The formula for RDA is: RDA = 1.2 * EAR
Where 1.2 is a constant when the information about standard deviation is insufficient and EAR is Estimated Average Requirement.
The EAR depends on:
Age
Height
Weight
Sex
Physical Activity level
Physiological condition (pregnancy, lactation etc.)
Modified Design Brief
To help Indian consumers construct a balanced diet.
Stacy arrives at the nearby megastore for bi-weekly shopping.
She plans to shop for herself, her husband, and her daughter.
The shopping will include items for each family member's needs.

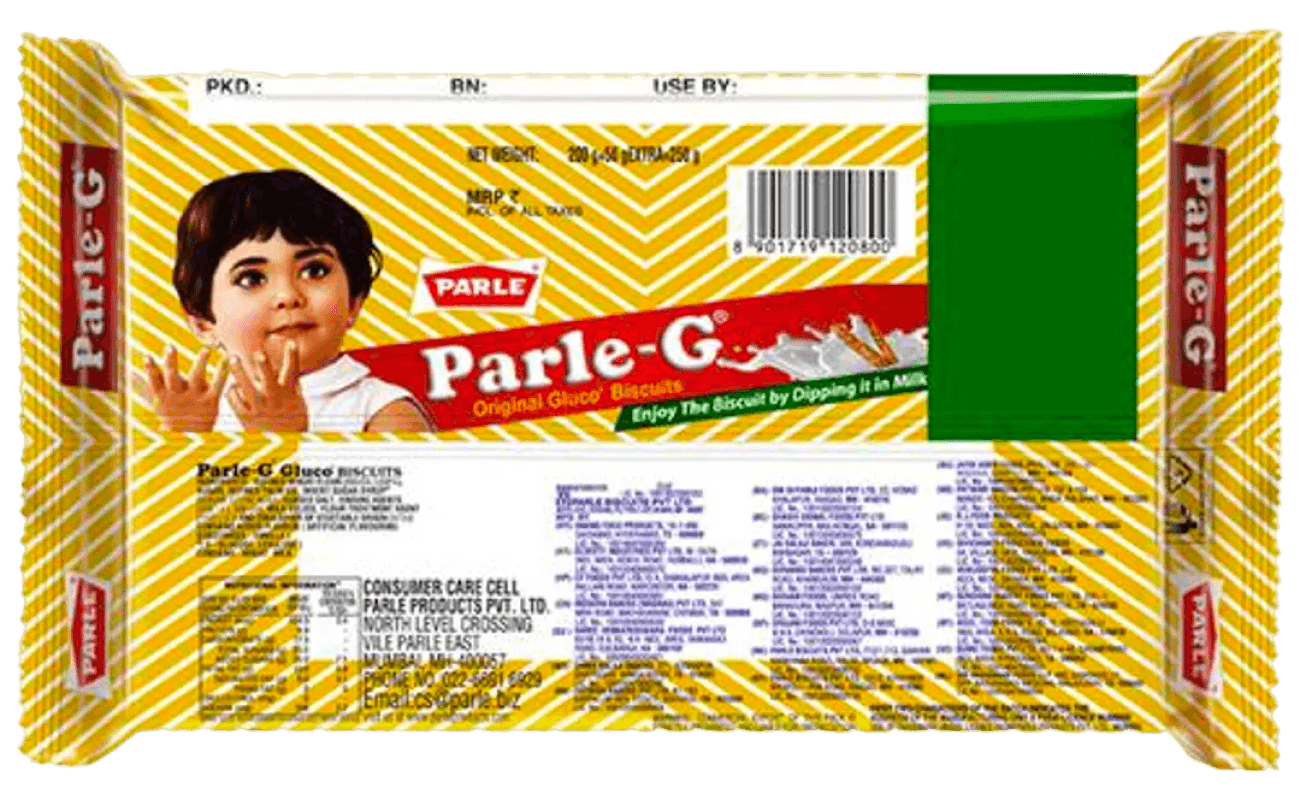
FMCG (Fast-Moving Consumer Goods) displayed at entrance.
She fills her cart with items such as biscuits, coffee, etc.
FMCG packaging lacks standard nutritional info, its difficult for her to assess the quantity of nutrients.
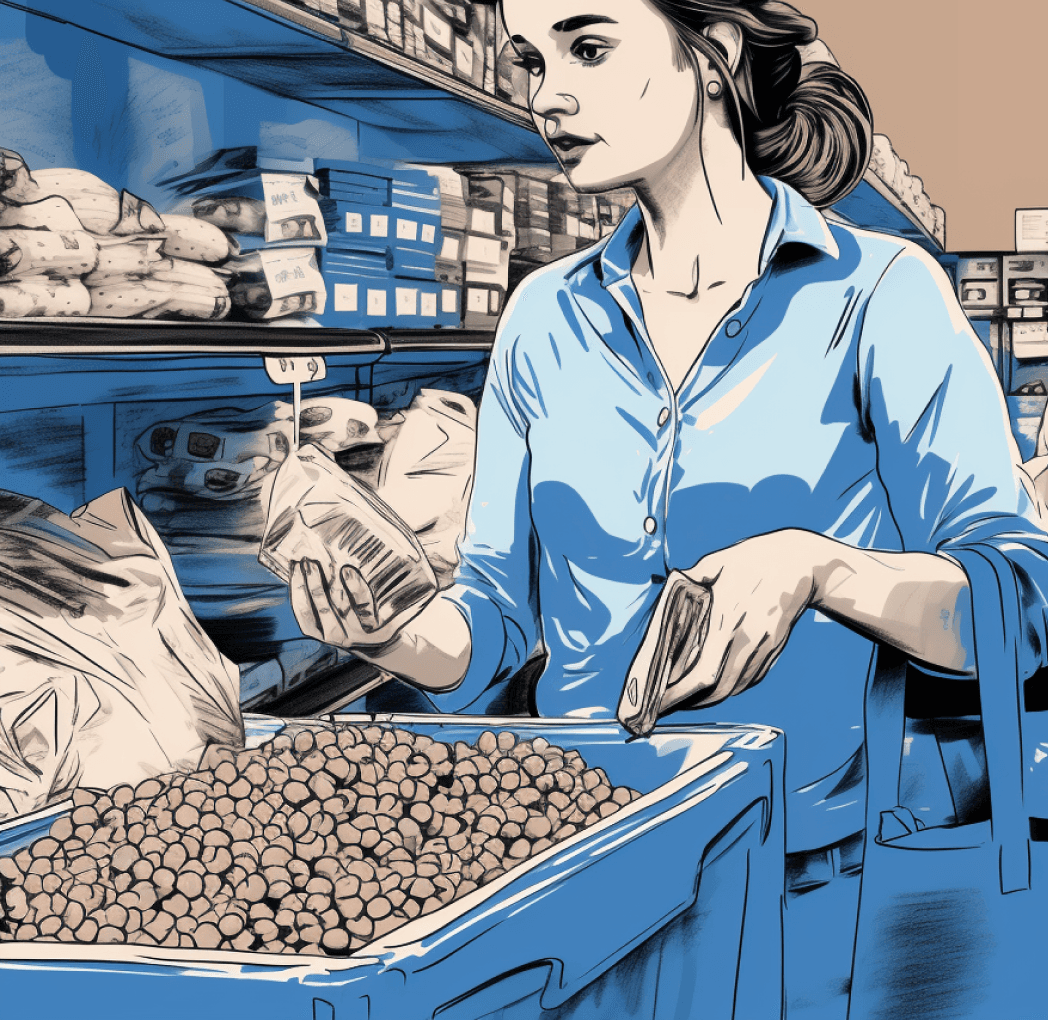
She moves to grains and pulses section.
Purchases pulses in loose quantity.
No nutritional information for pulses and grains available for loose items.
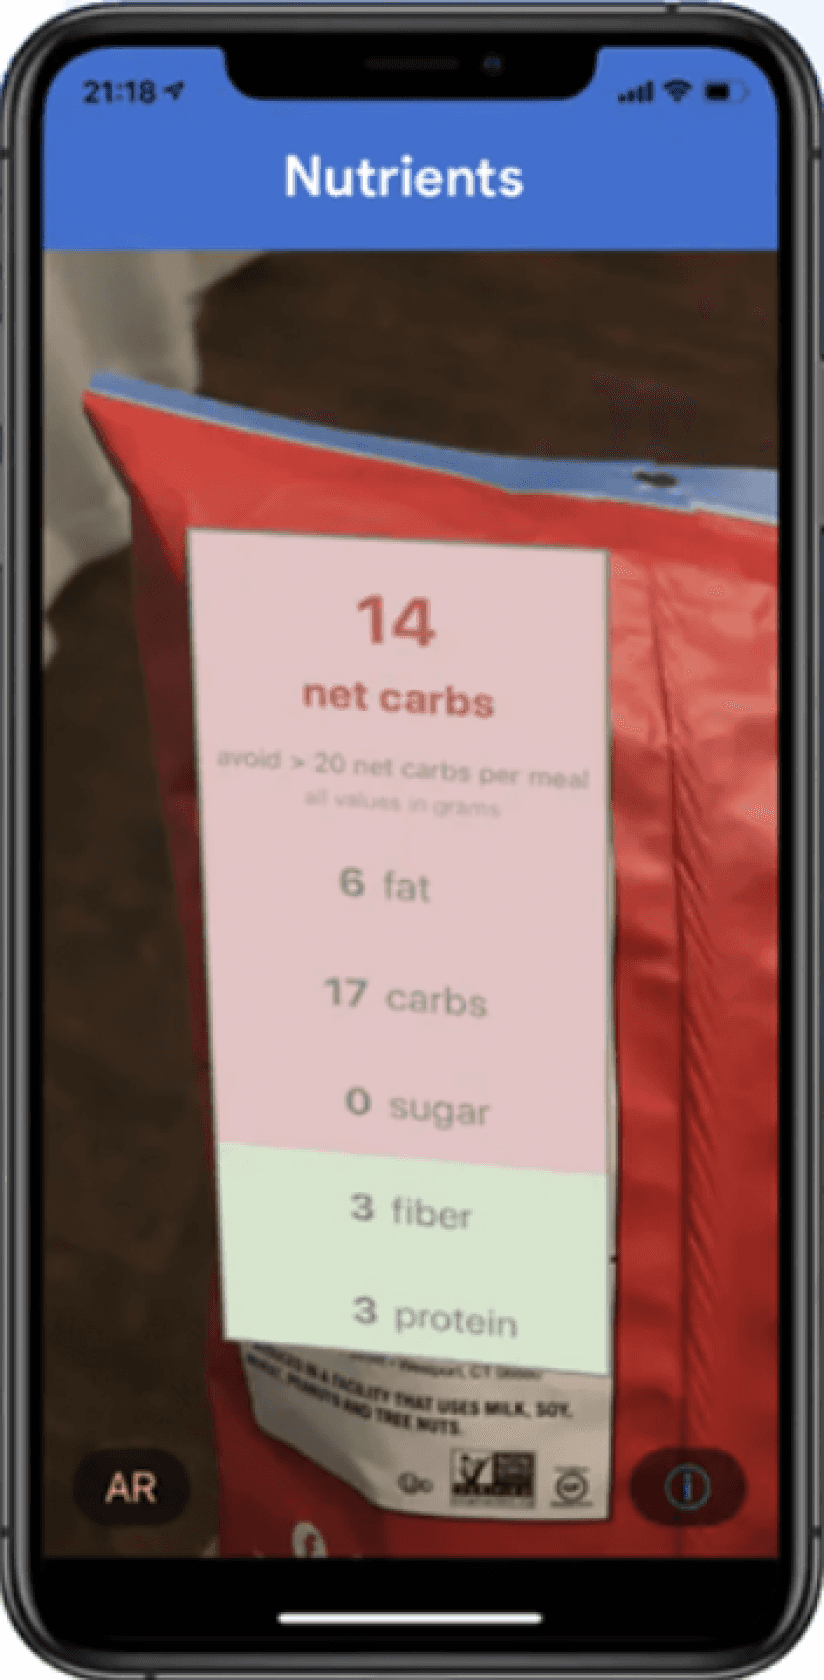
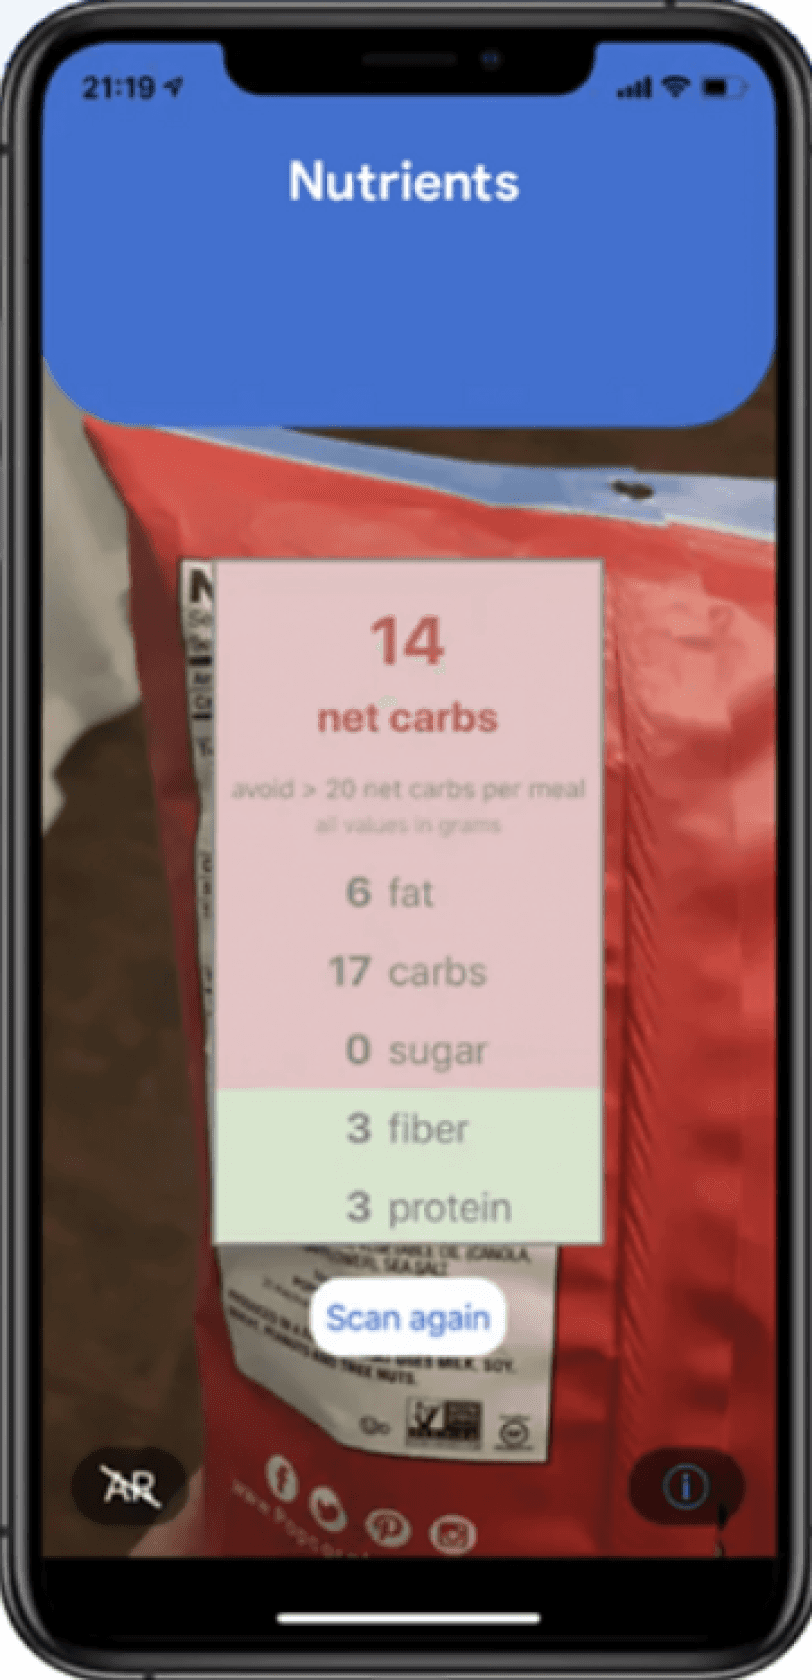
Intervention 1 : Encoding all nutrients into scannable QR code
A special QR code is pasted on the back of every product, which gives information about necessary nutrients

Nutrient info transfer
QR sticker
Sticker pasted to product
Product is scanned to view necessary nutrients
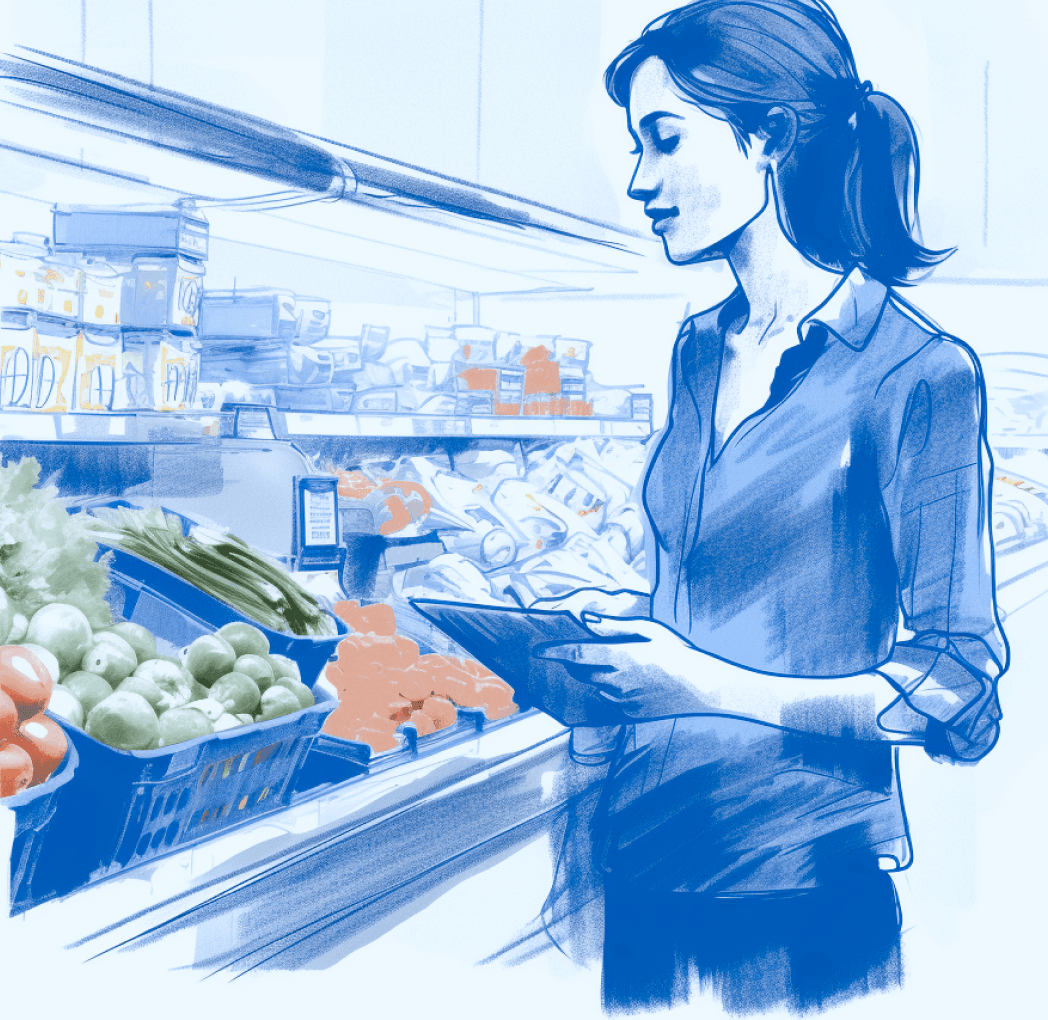
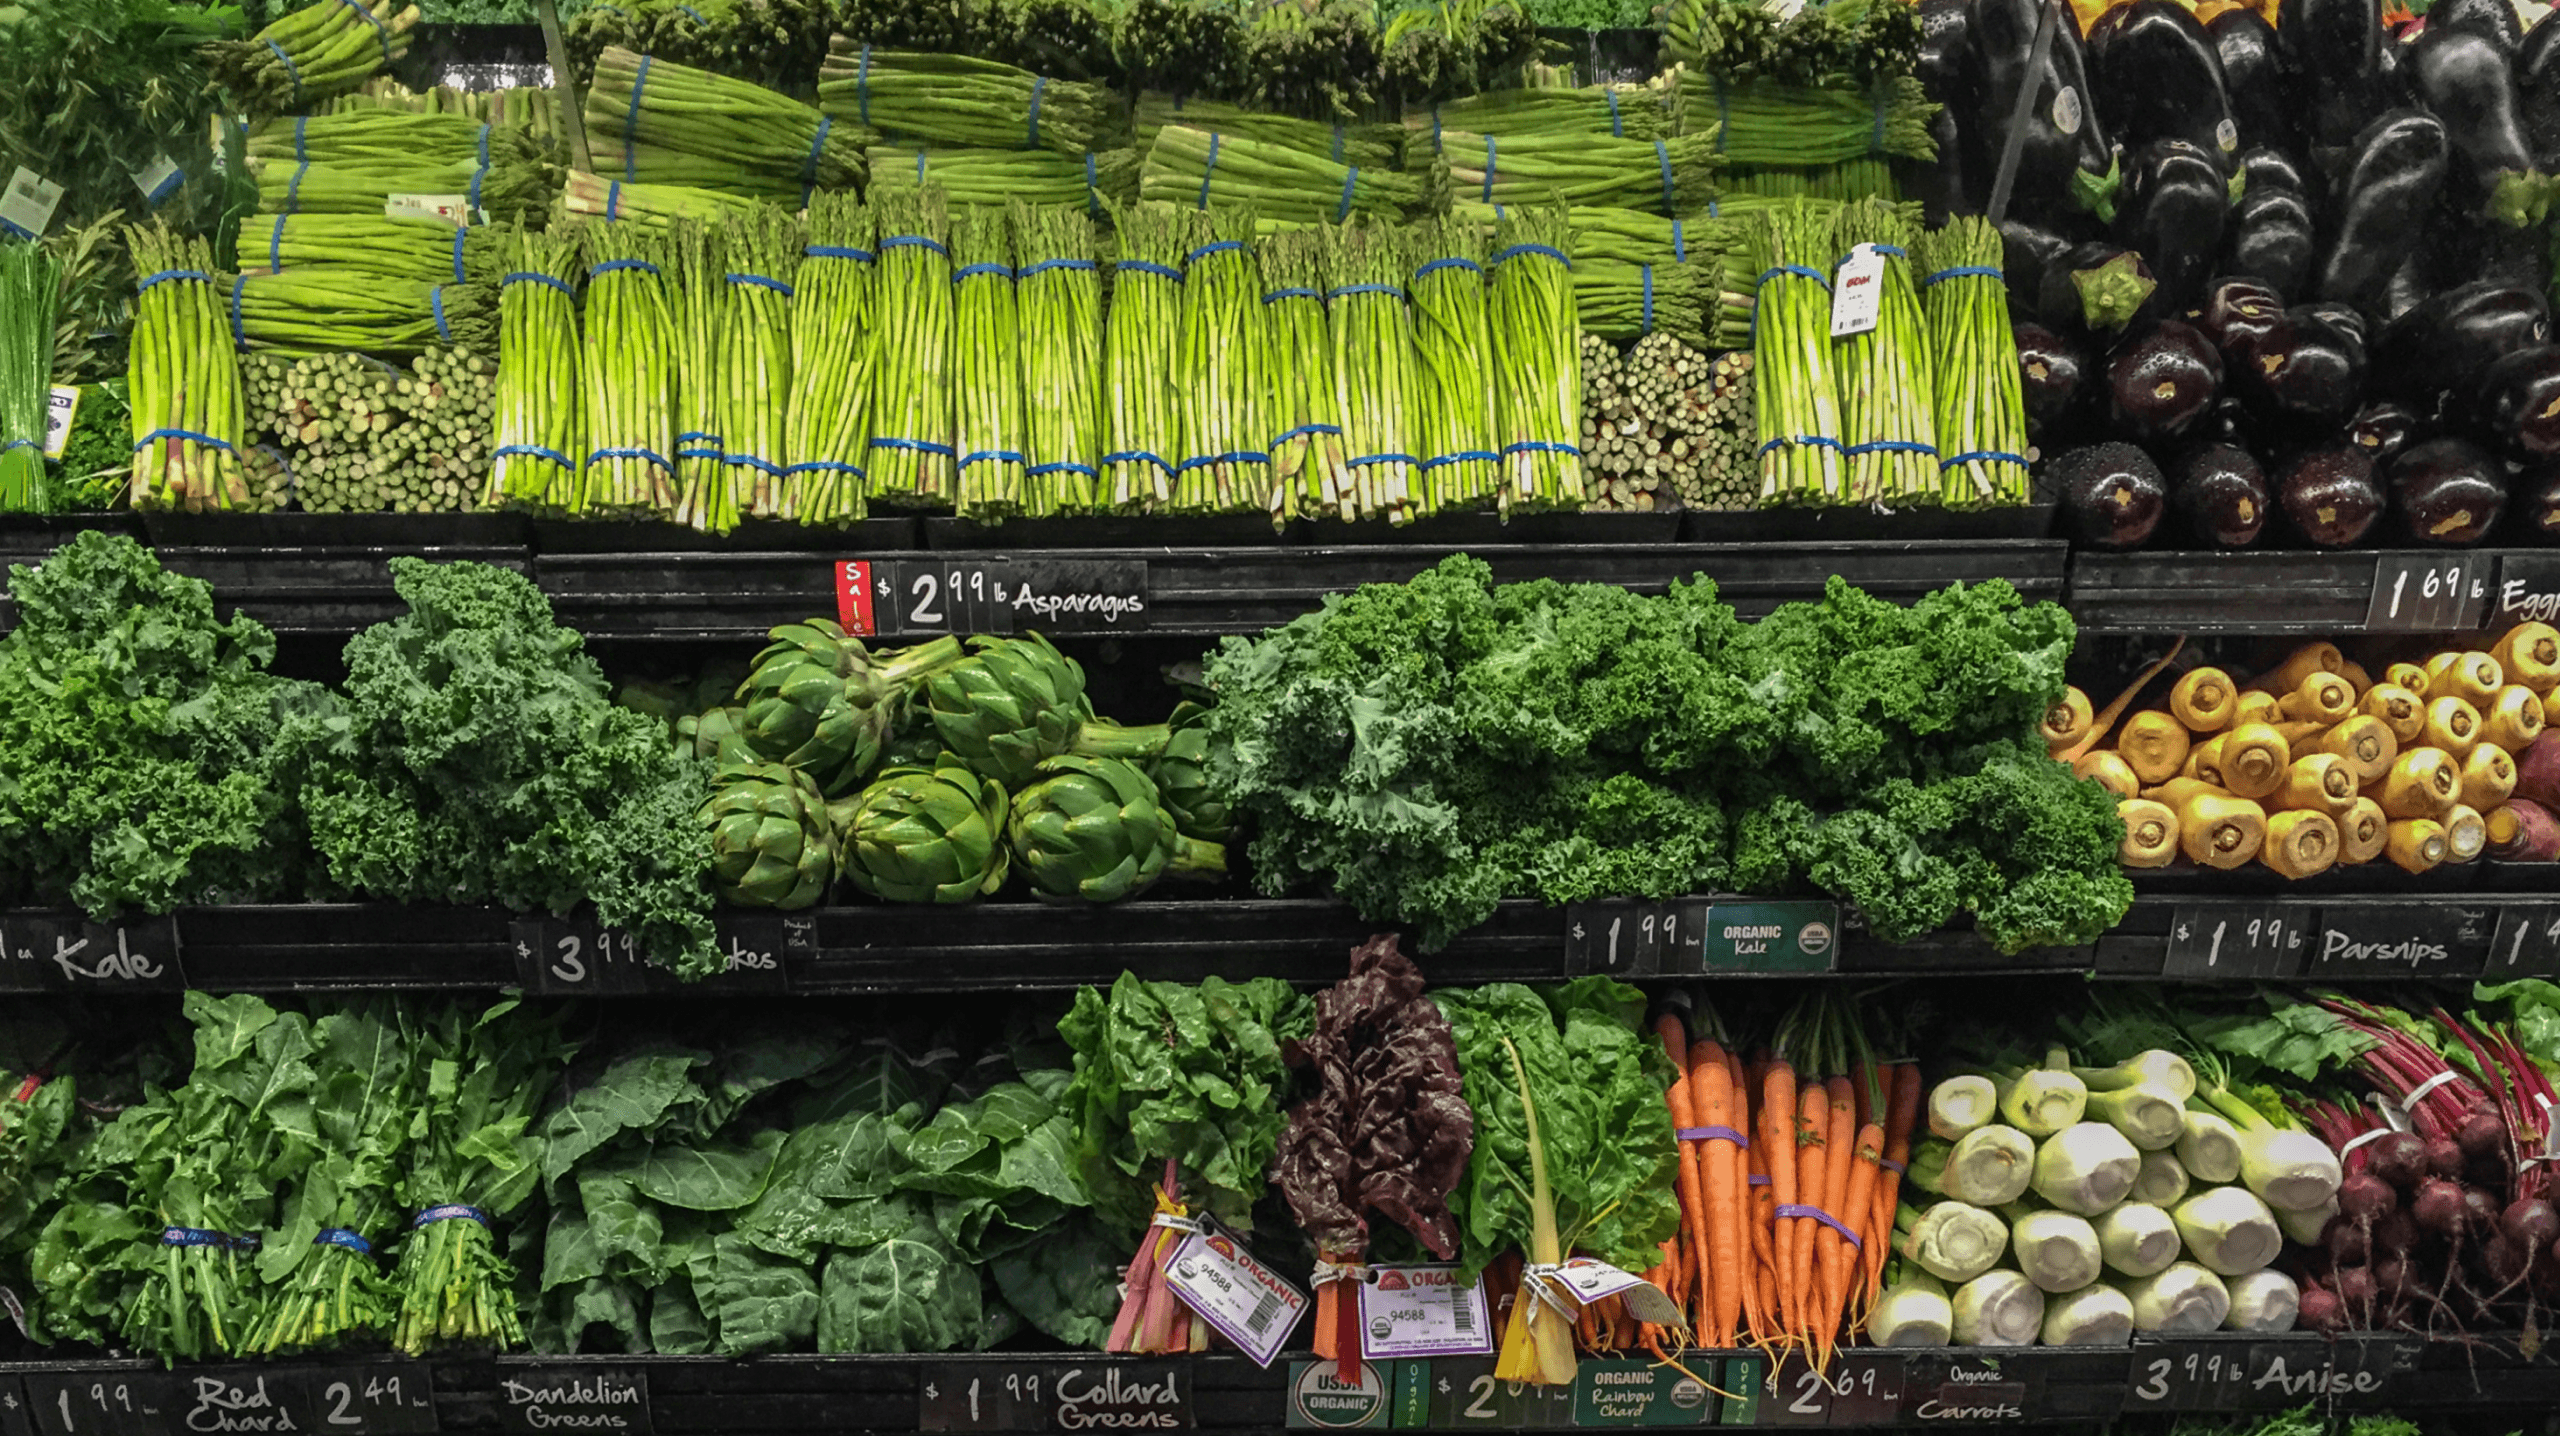
She reaches fruits and vegetables section.
Except the name and price per unit, there was nothing else mentioned.
She founds no nutritional information for Fruit & Veggies.

Stacy bought FMCG products.
She bought pulses in loose quantity, oil & fruits and veggies.
She finally does checkout from the store.

Stacy has no idea how much nutrients she is taking home.
It could be more than anticipated
Or maybe its less than anticipated, but it could also be from bad sources.
Final Solution:
This solution has been made to enhance the shopping experience of fruits and vegetables only because F&Vs makes half of the platter and are the primary and most beneficial source of diverse nutrients
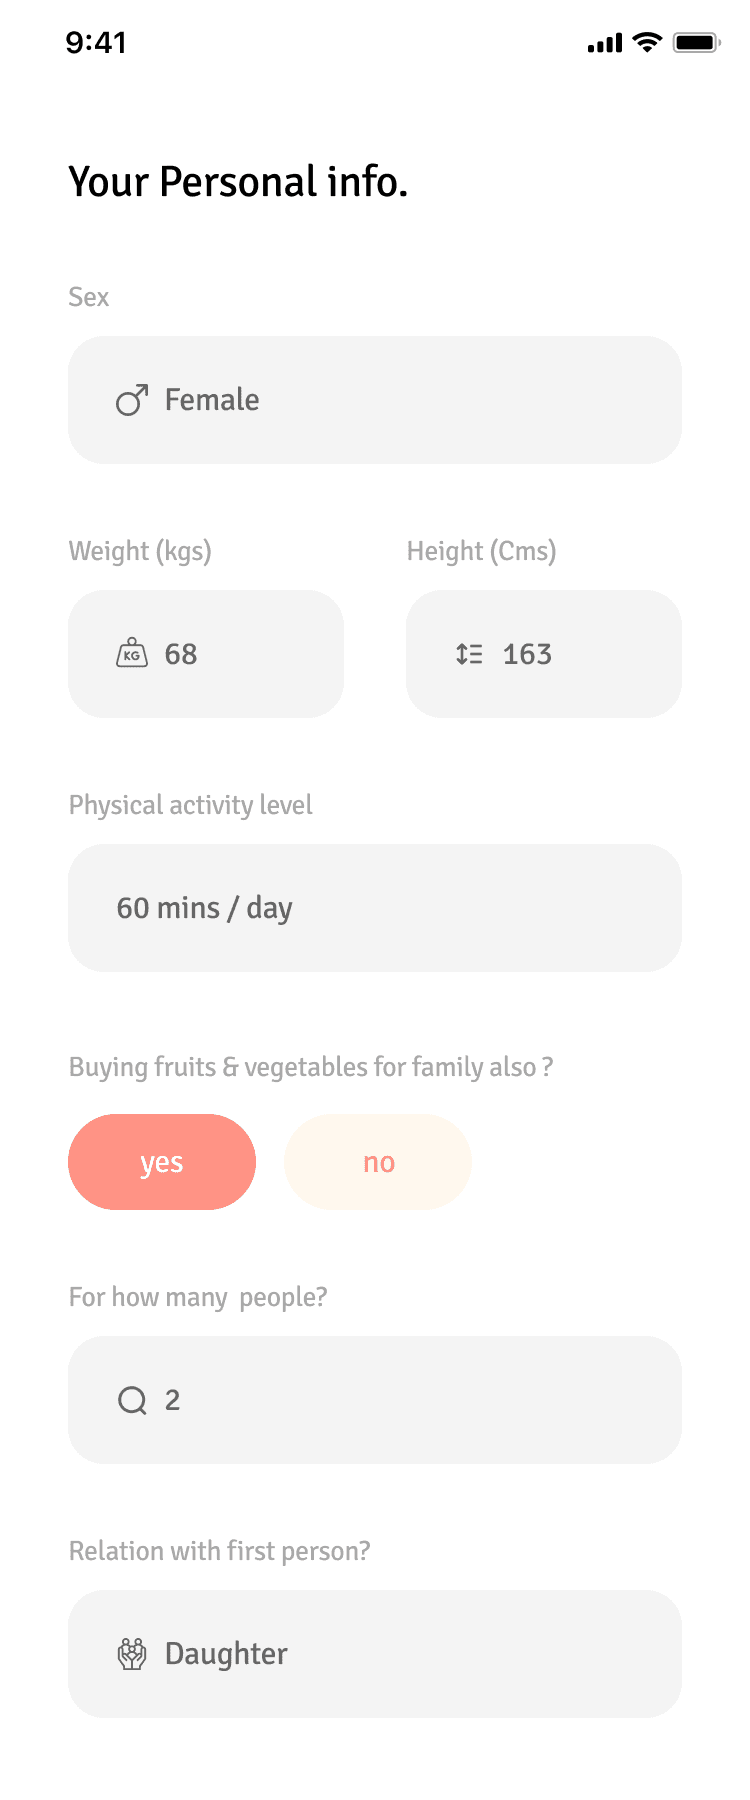
How Does it work:
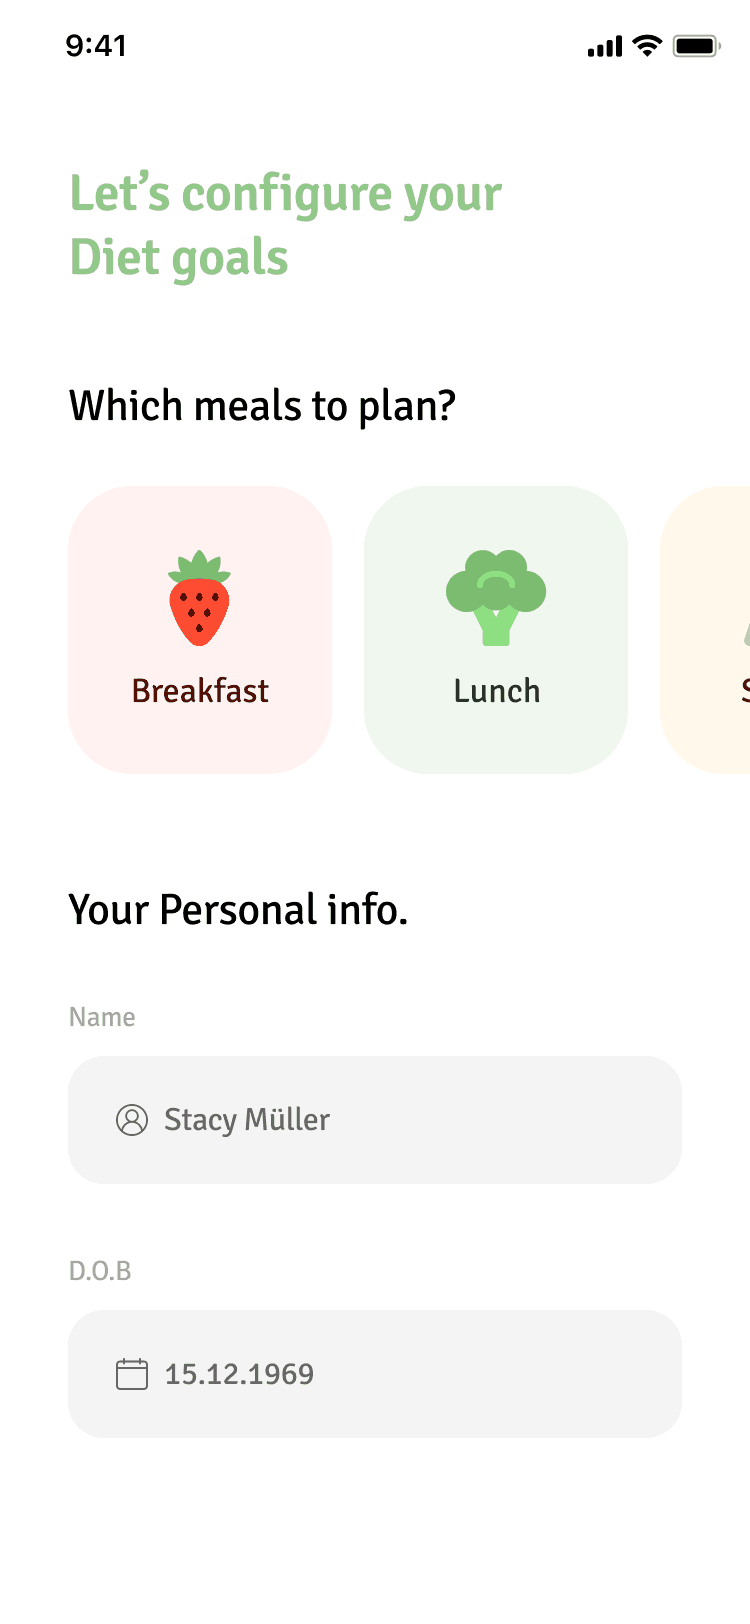
Ask basic BMI info.
Age: User's age recorded for tailored health insights.
Gender: Note user gender for personalized nutritional guidance.
Measurements: Collect weight, height, and activity for individualized recommendations.
Calculate RDA
Assess EAR: Determine user's Estimated Average Requirement for nutritional insights.
Calculate RDA: Utilize EAR to compute Recommended Dietary Allowance for personalized guidance.
Suggest & monitor nutrients
Realtime Tracking: Properly displays nutrient fulfillment from fruits and vegetables as users shop.
Cart Monitoring: Track nutrient intake as users fill their carts for instant feedback.
Enhanced Shopping: Improve nutrition awareness with real-time nutrient updates while shopping.
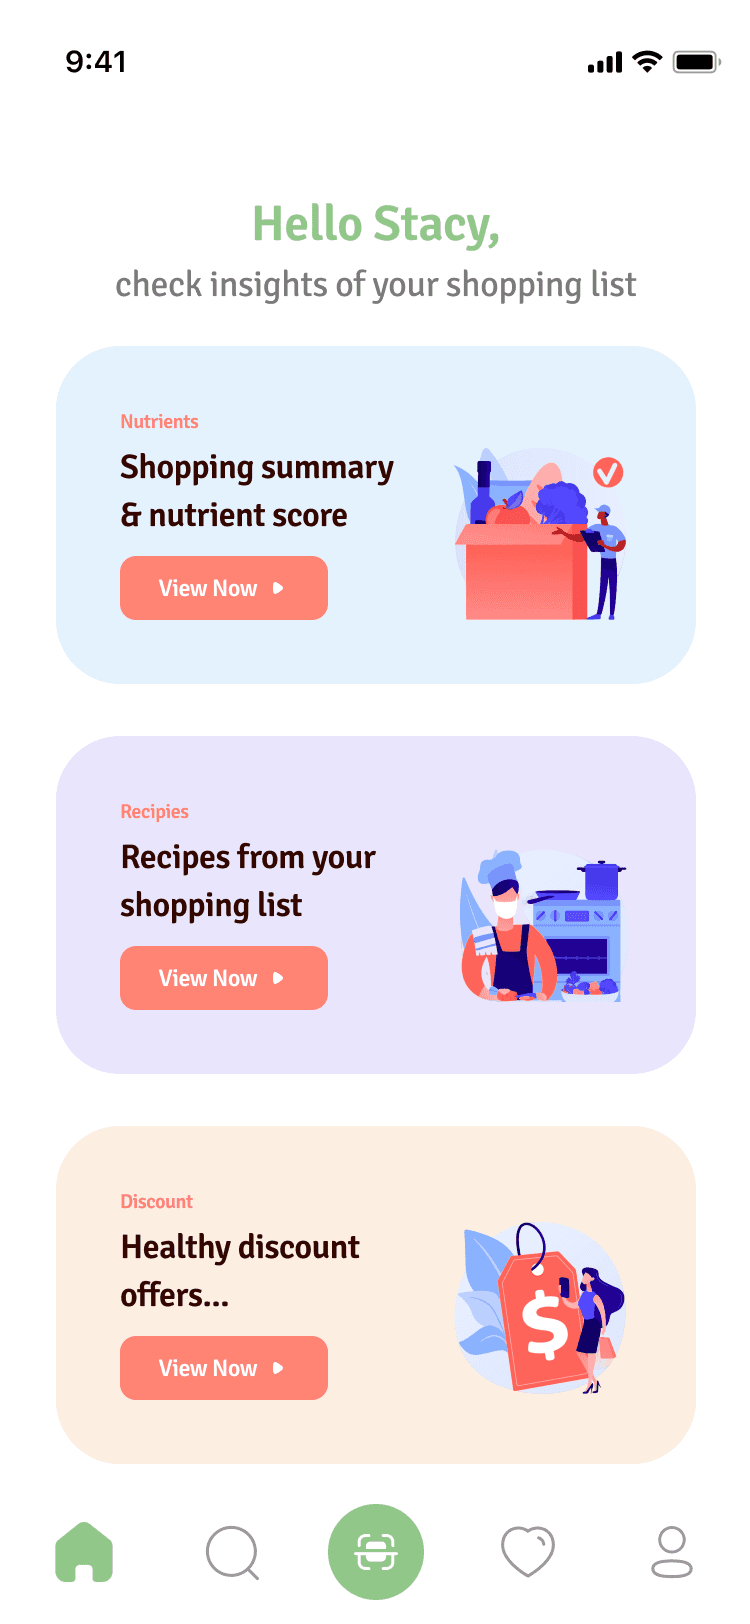
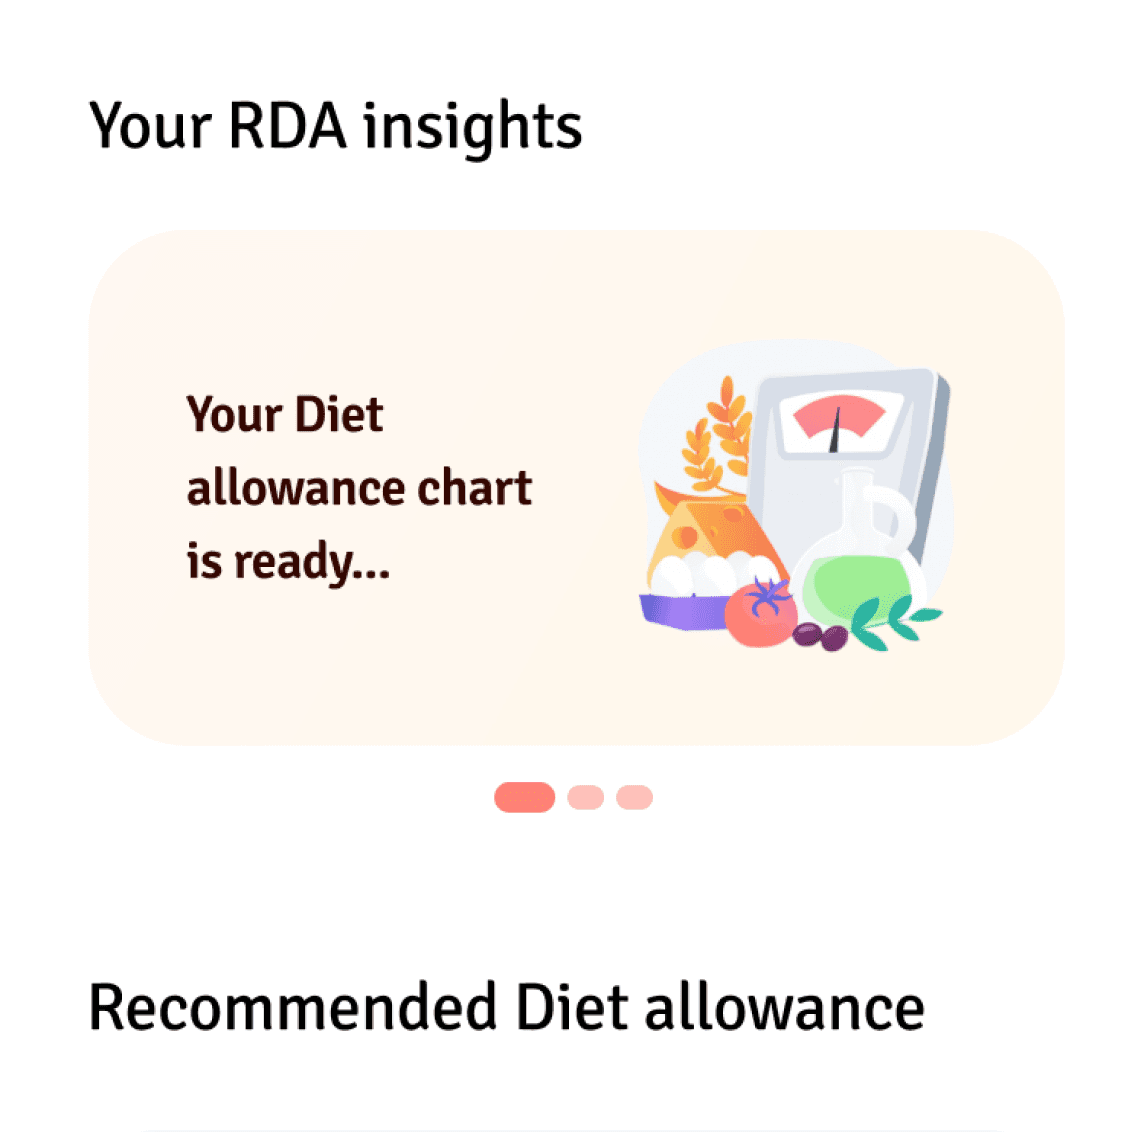
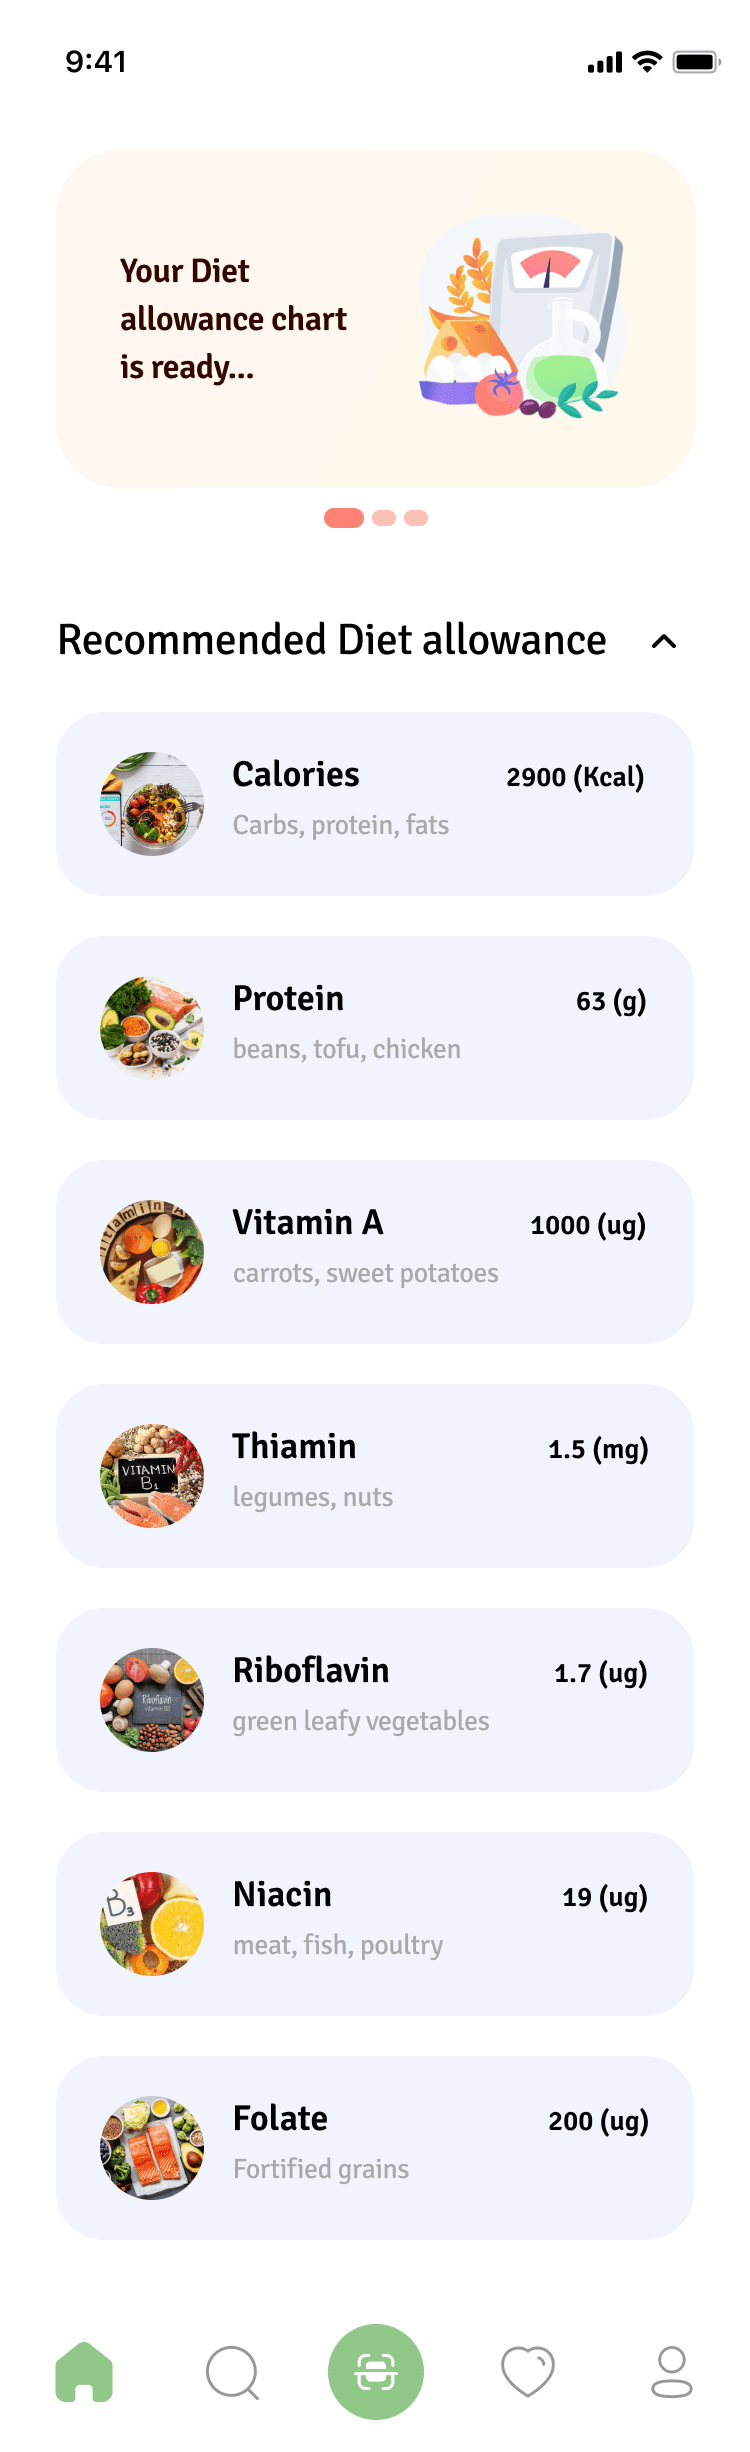
User Experience before shopping
User registers into Nutricart app, to get a personalised Nutrition score and recommended dietary allowance for individual or family
Onboarding and gathering customer necessary physical information Via a app or PWA

Asking if the user shops for family members also
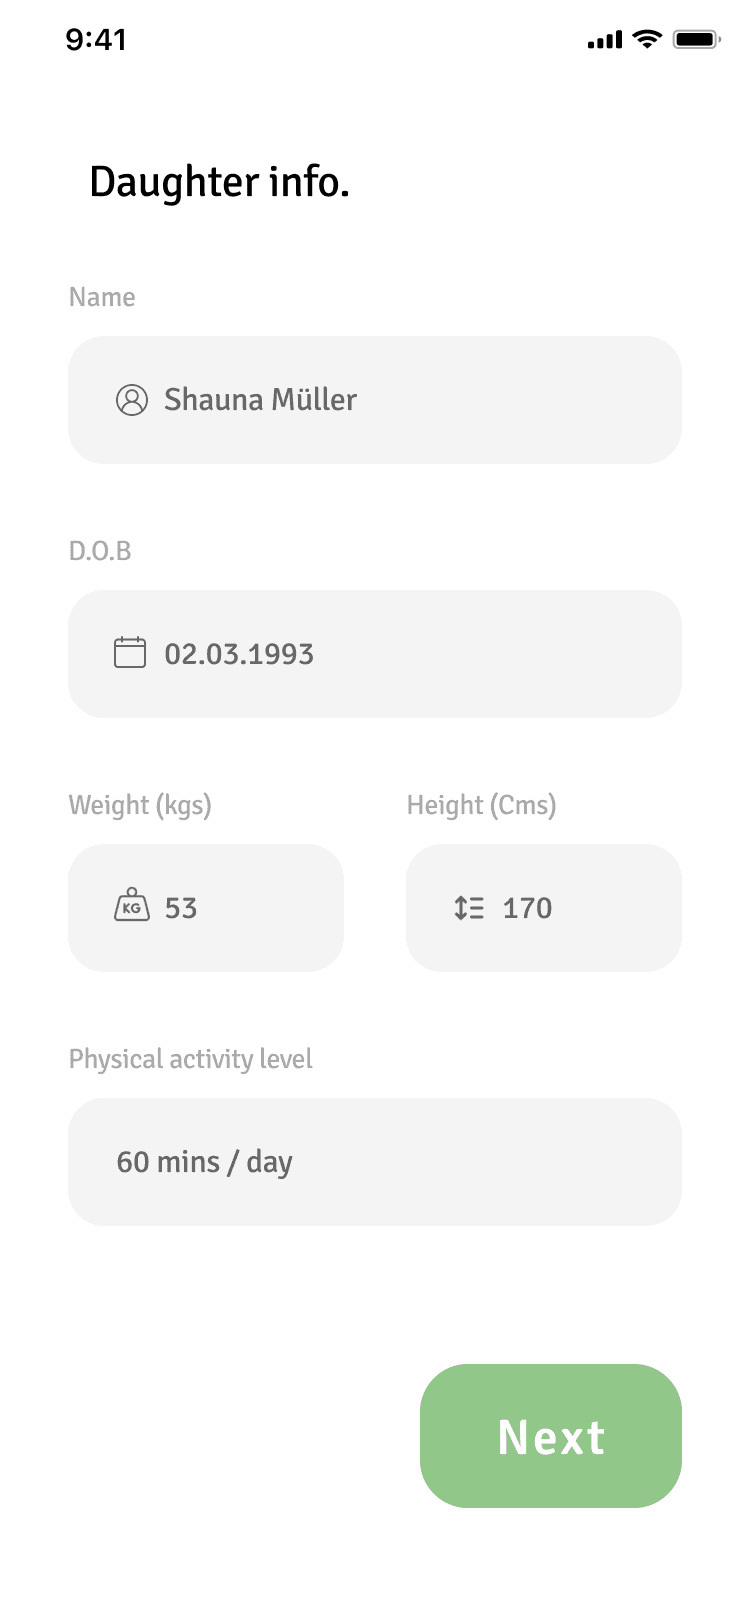
If User is shopping for family also then collecting basic family info

The customer is now registered.
Based on the Information provided a EAR and Recommended Dietary allowance is generated.
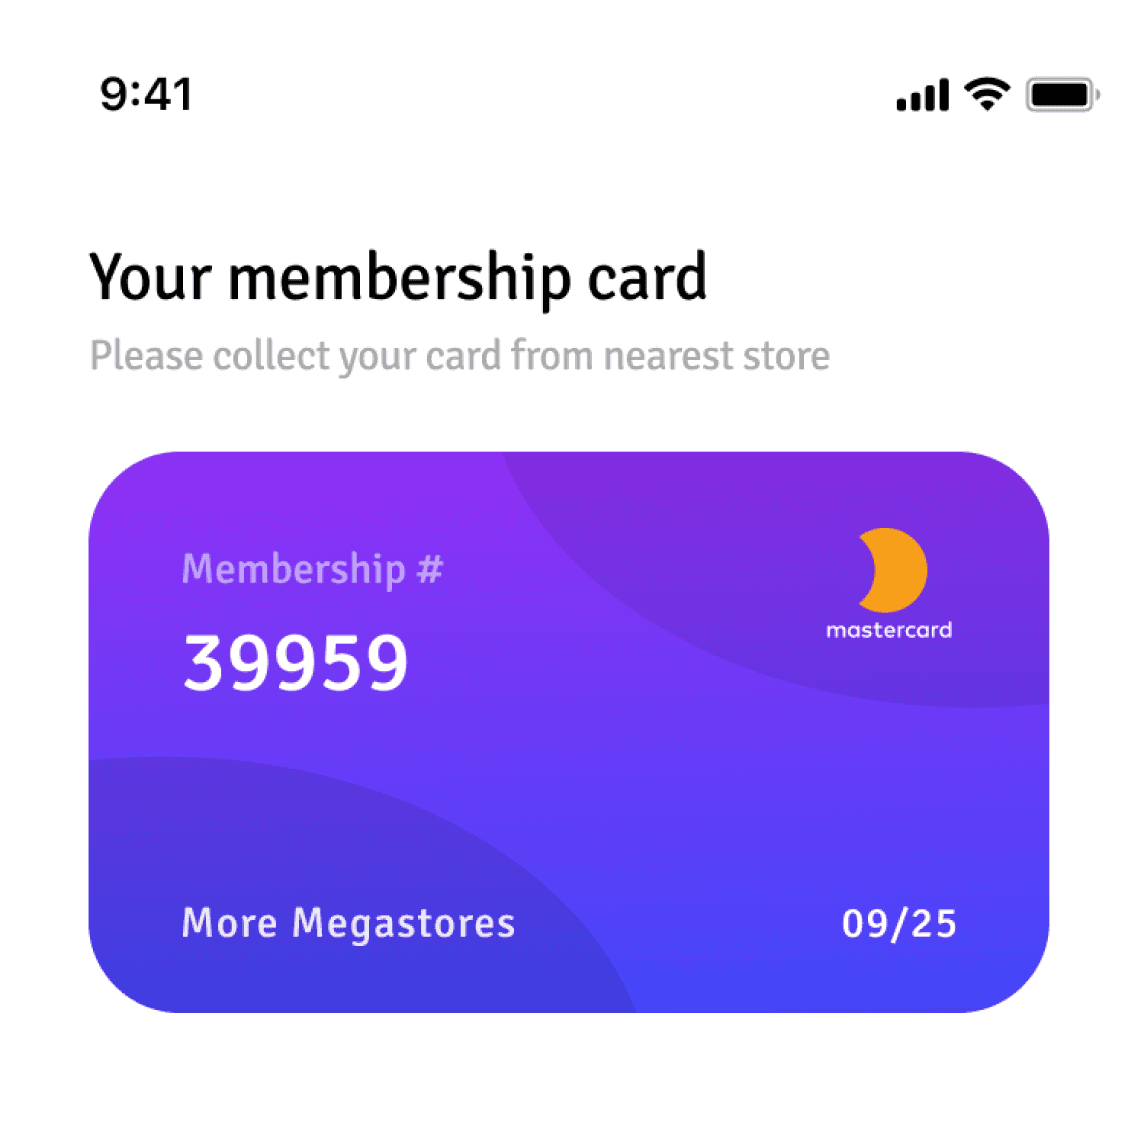
A membership card is also provided which customer can collect from store.
User Experience while at shopping store
The data from the Recommended Dietary Allowance will guide users in grocery shopping, utilizing a smart cart equipped with a tablet screen interface.

Stacy arrives at the nearby megastore for bi-weekly shopping.
She plans to shop for herself, her husband, and her daughter.

Nutri smart cart helps you count your nutrients while shopping
The smart cart can scan your Items on go


Stacy taps the membership card on the smart cart and start shopping
All the RDA shopping and nutrient info will be shown on cart display.
After swiping the membership card.
The display in the cart asks her for whom she would shop today.
It also ask if shopping is for the whole week? and based on that RDA of the family is calculated.

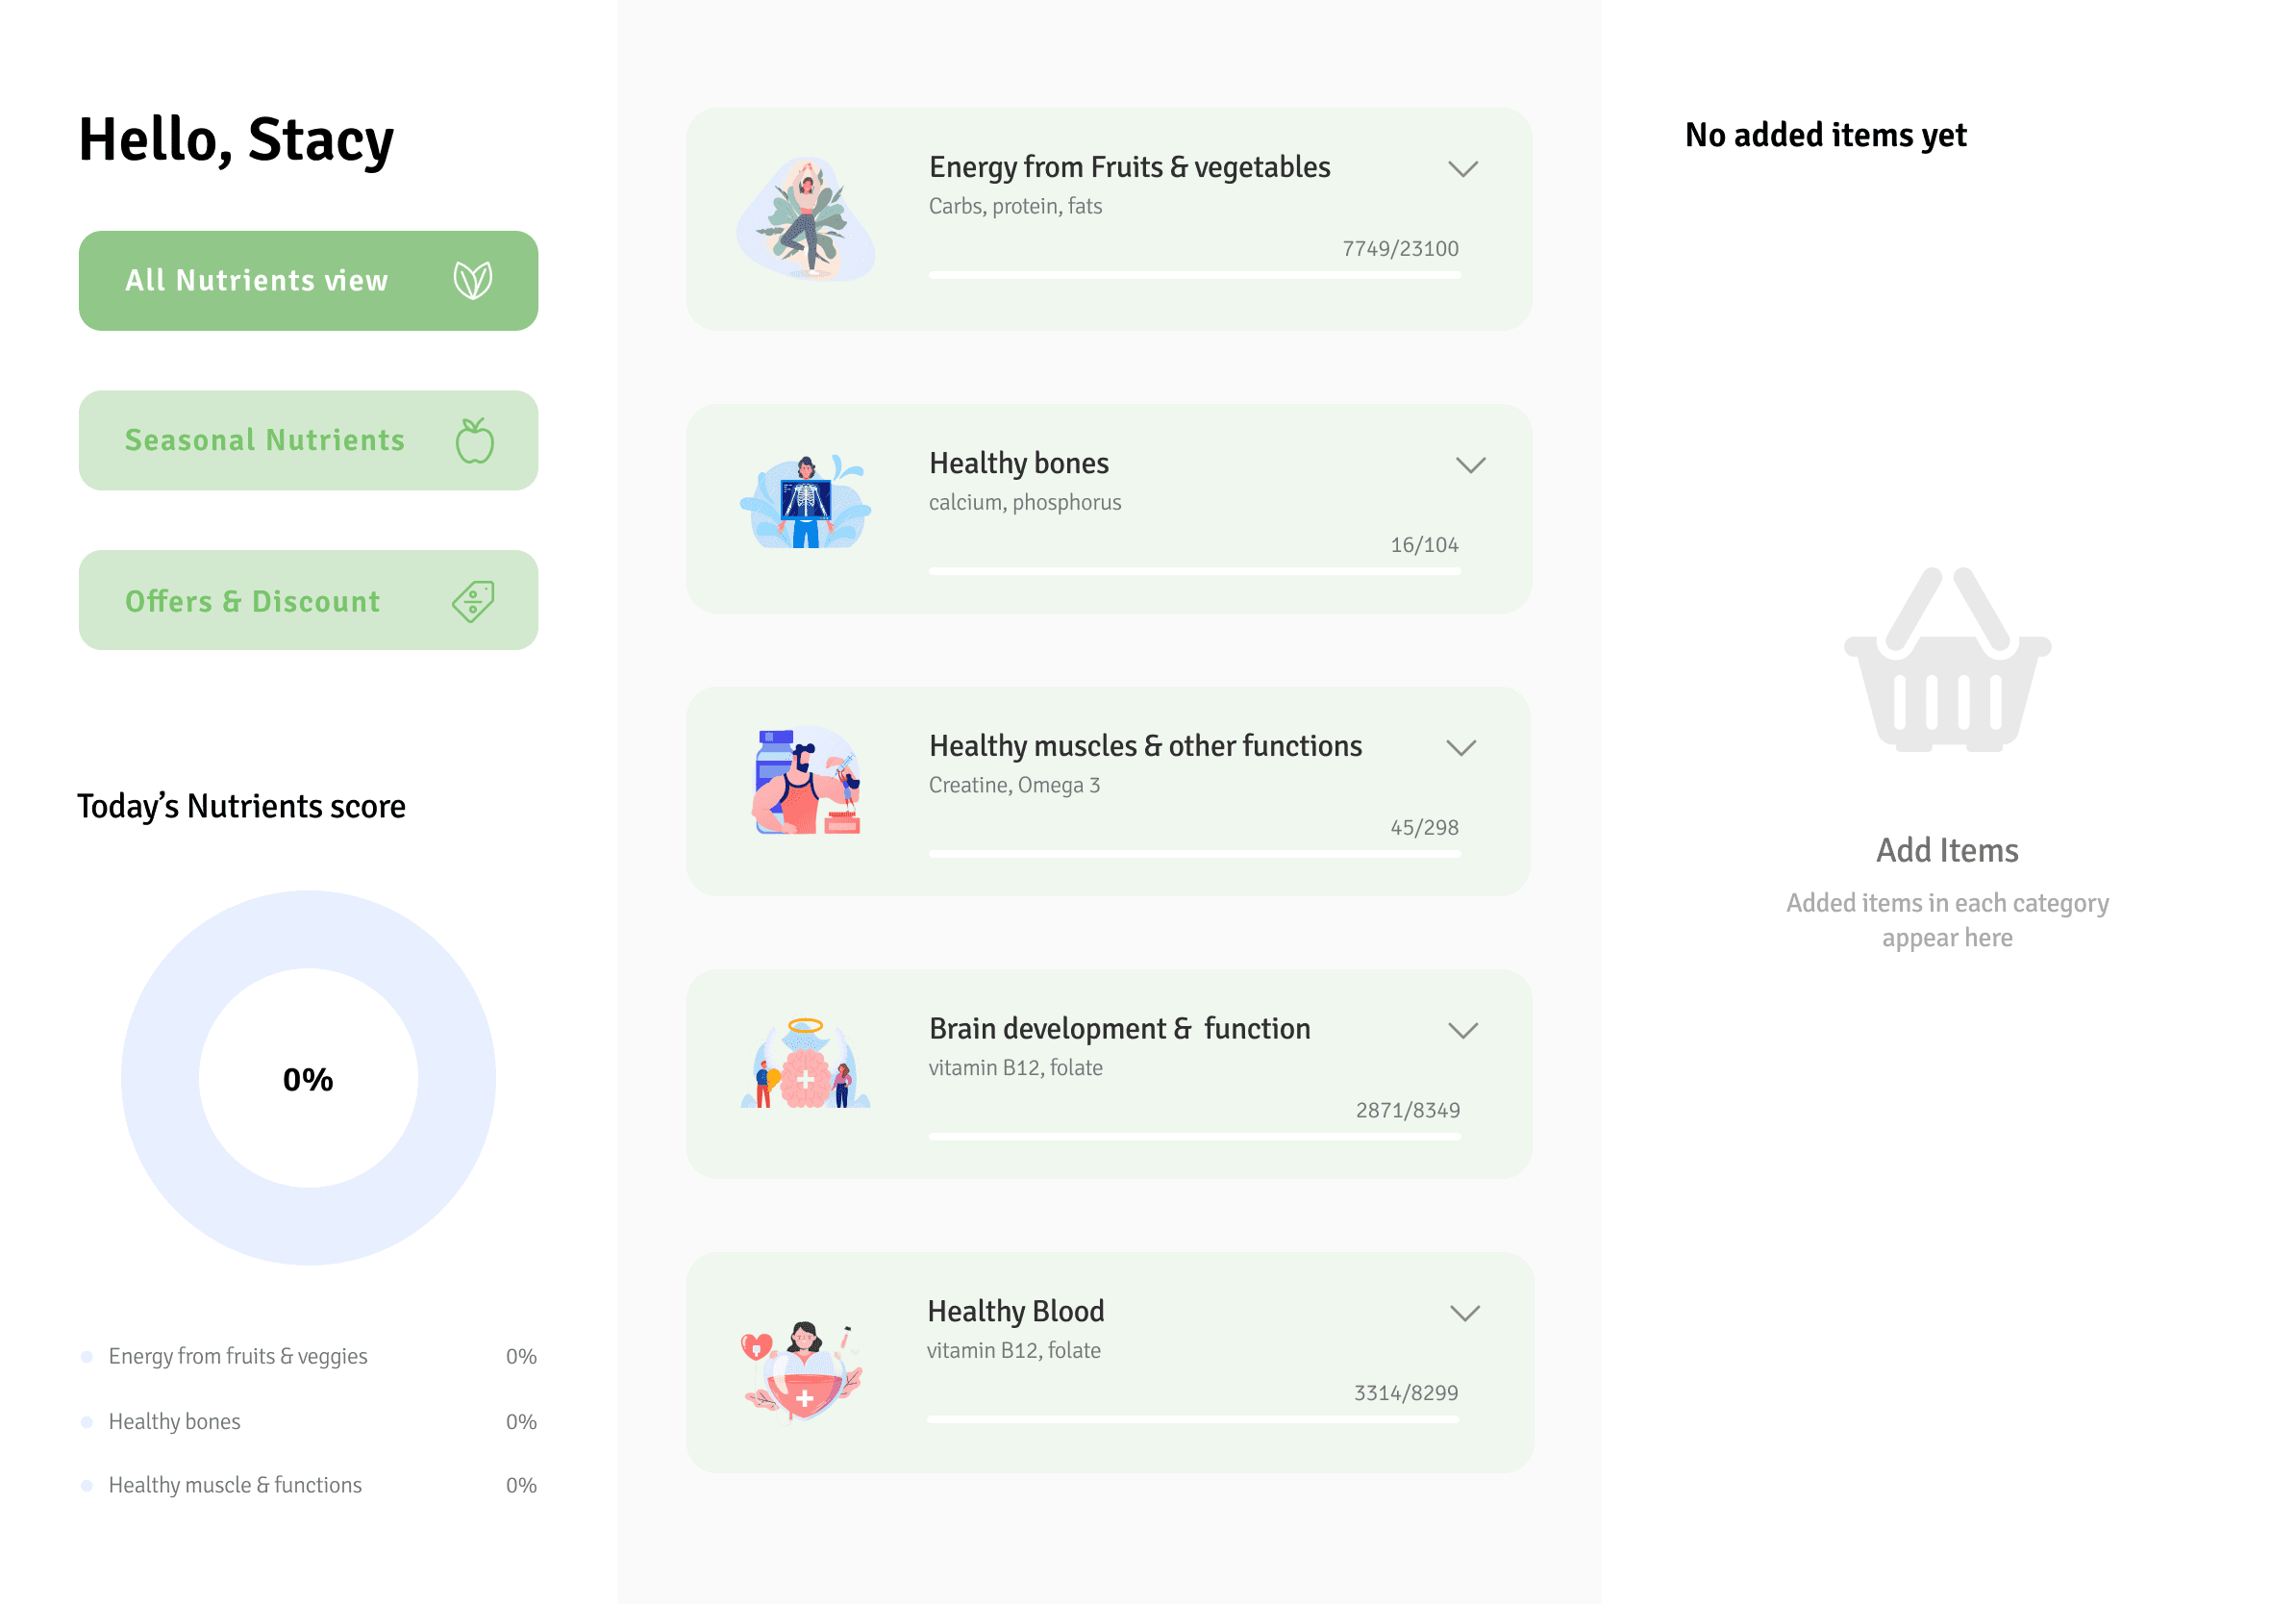
After calculating the nutrient required for the week, a nutrient list is generated and shown.
Initially the progress bar of each category is empty because no items are scanned yet.
The progress bar will start moving as soon as the groceries are scanned.
After calculating the nutrient required for the week, a nutrient list is generated and shown.
Initially the progress bar of each category is empty because no items are scanned yet.
The progress bar will start moving as soon as the groceries are scanned.
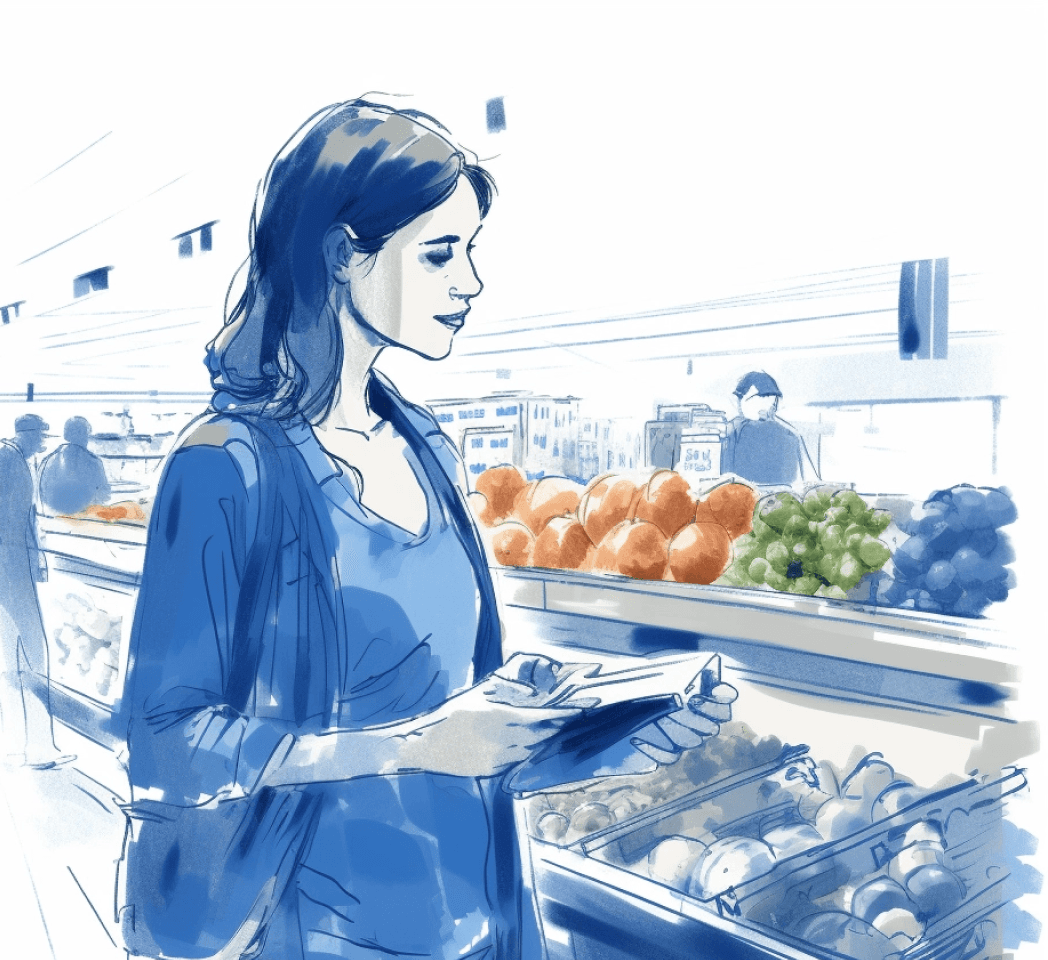
Stacy arrives at the fruit and vegetable section.
She selects some fruits and veggies to buy.

She packs some apples and scans generated QR code.
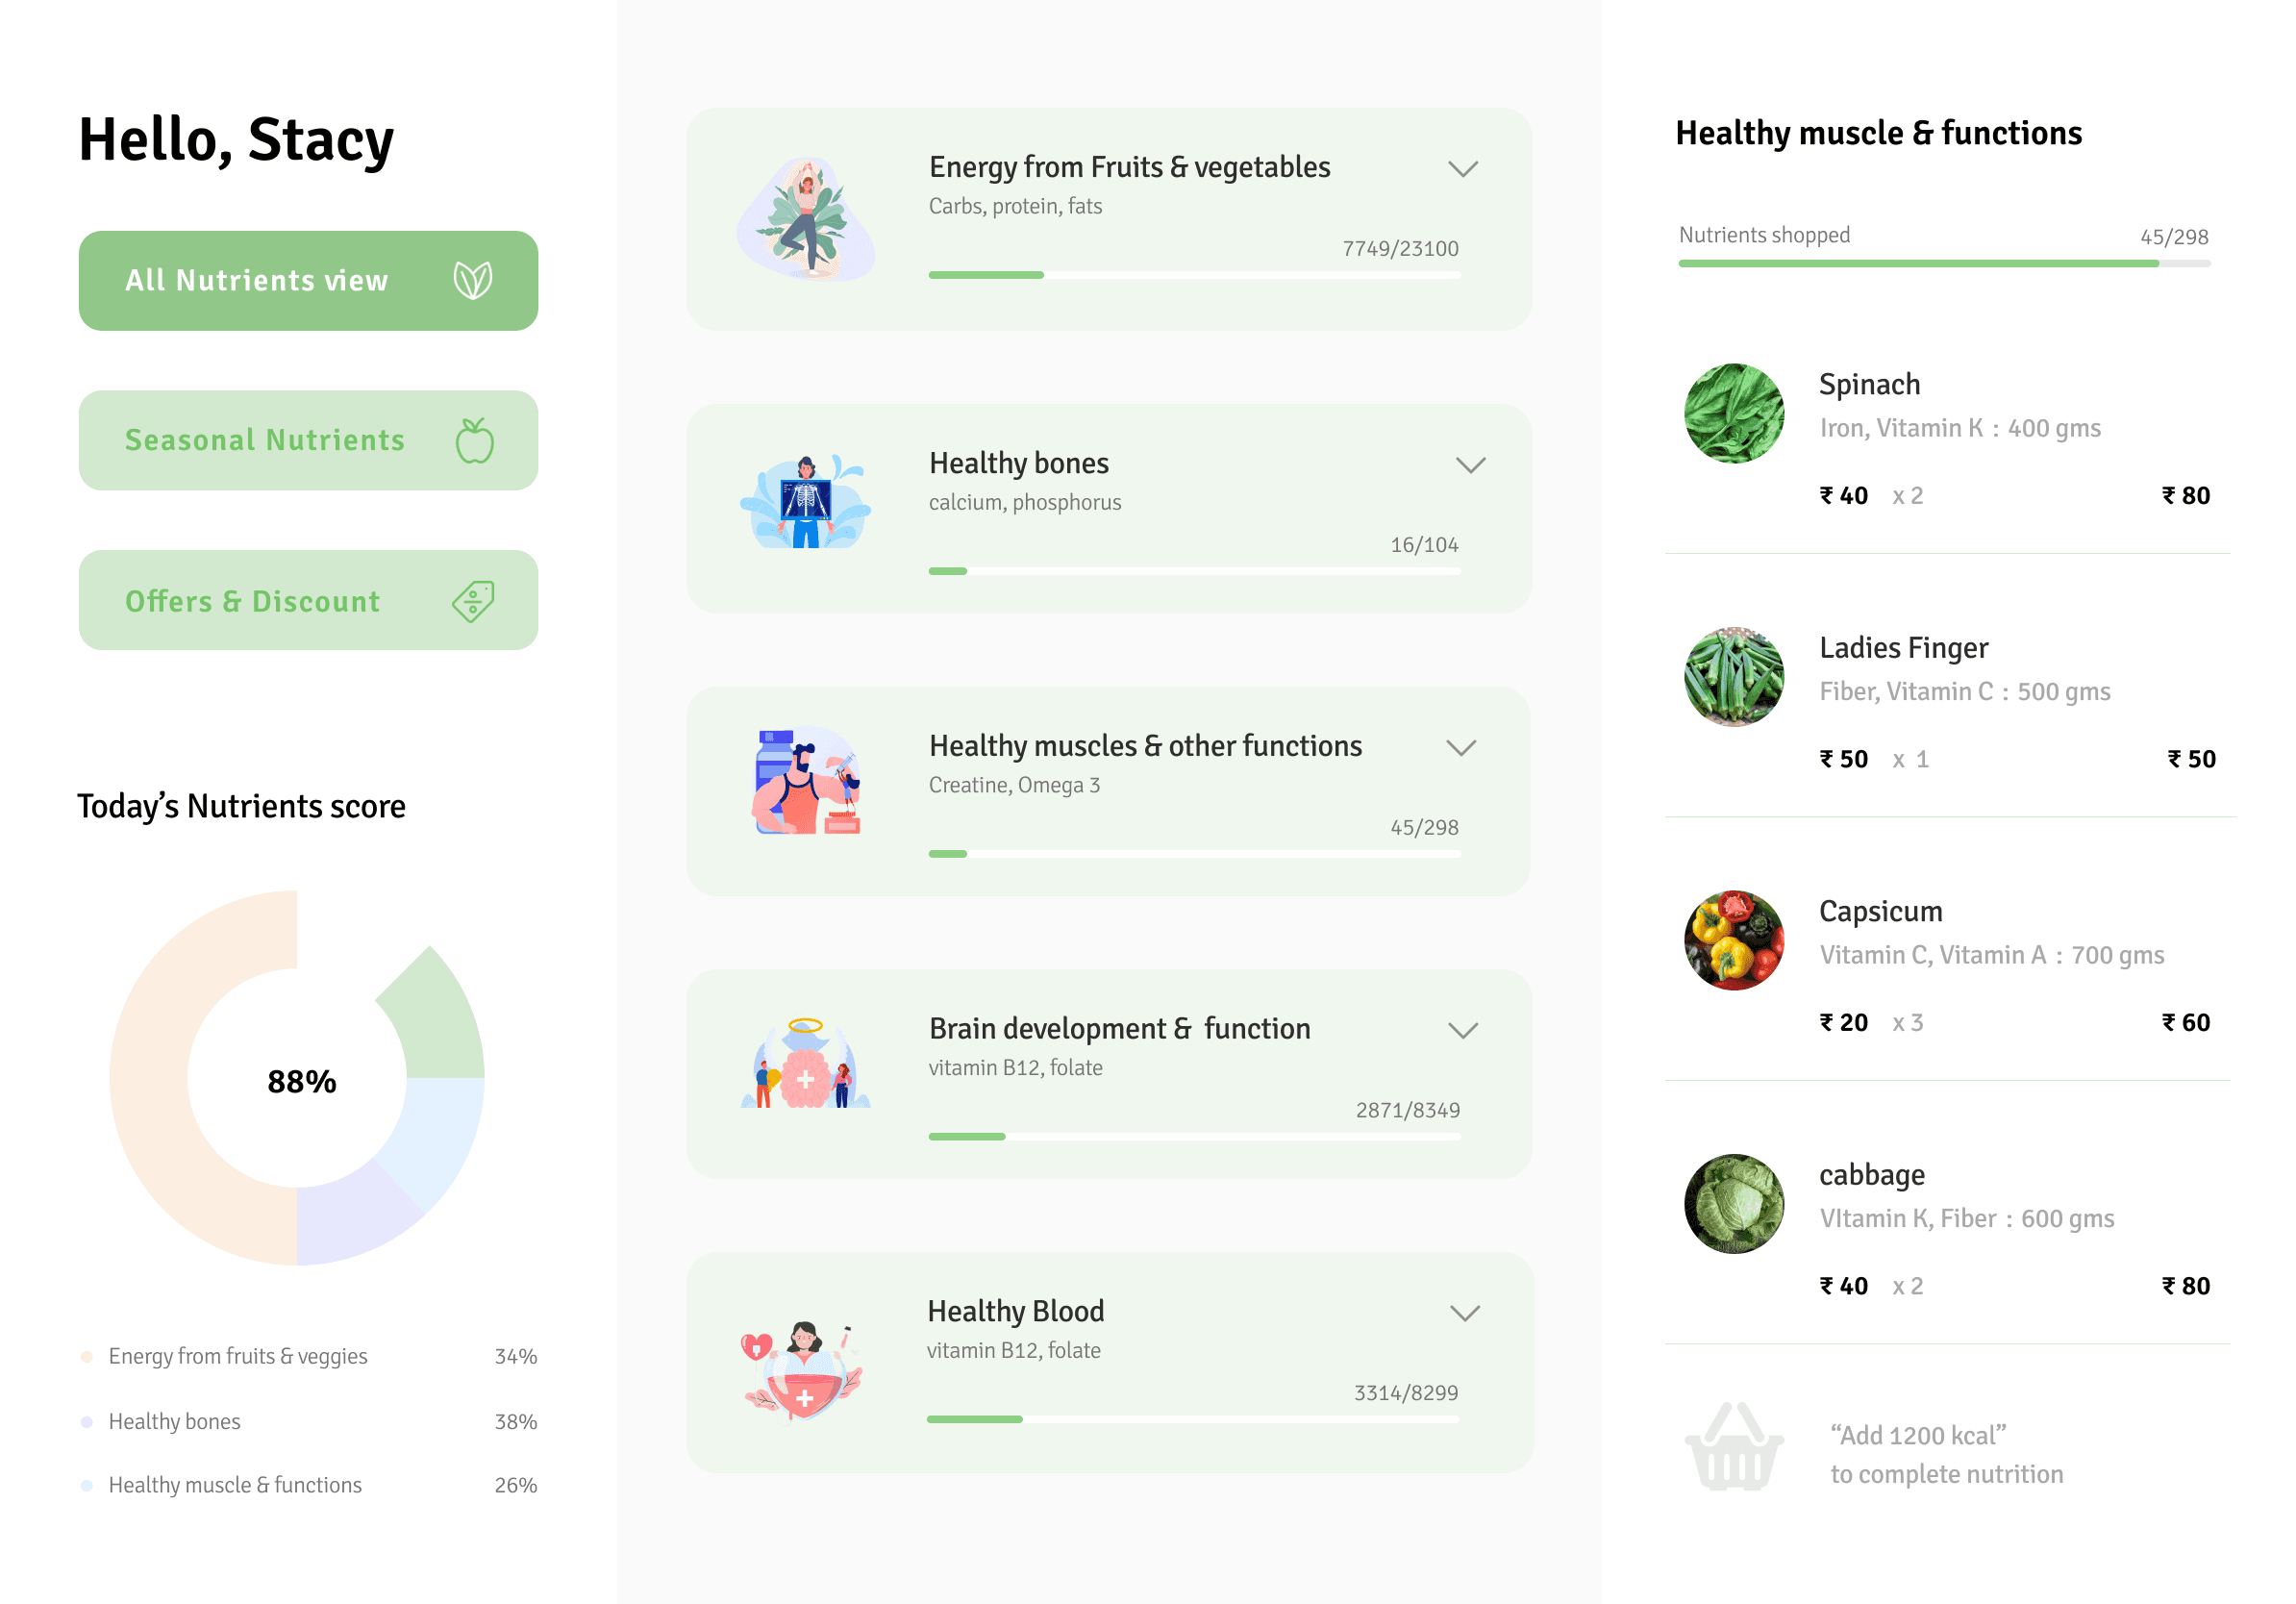
She puts the parcel into her cart, as she scans the progress bar updates realtime.

After scanning she can check if the nutrients are completed in each category.
She can select a nutrient category and see all the shopped items inside that category.

She does checkout of all the items she purchased and getting the nutrient informations along the way

She now has a cart full of nutrients rich food.
The nutrient rich food fulfils the RDA of entire family for the week till next shopping.

She is happy that she is carrying a cart full of healthy groceries.
She can now have a balanced diet for herself and her family everyday or week.
Stacy also gets the total nutrients information on her bill too...

User Experience after bringing the shopping ingredients home.
Stacy bi weekly shopping data is transferred into her personalised app
She can go to her recently shopping summary
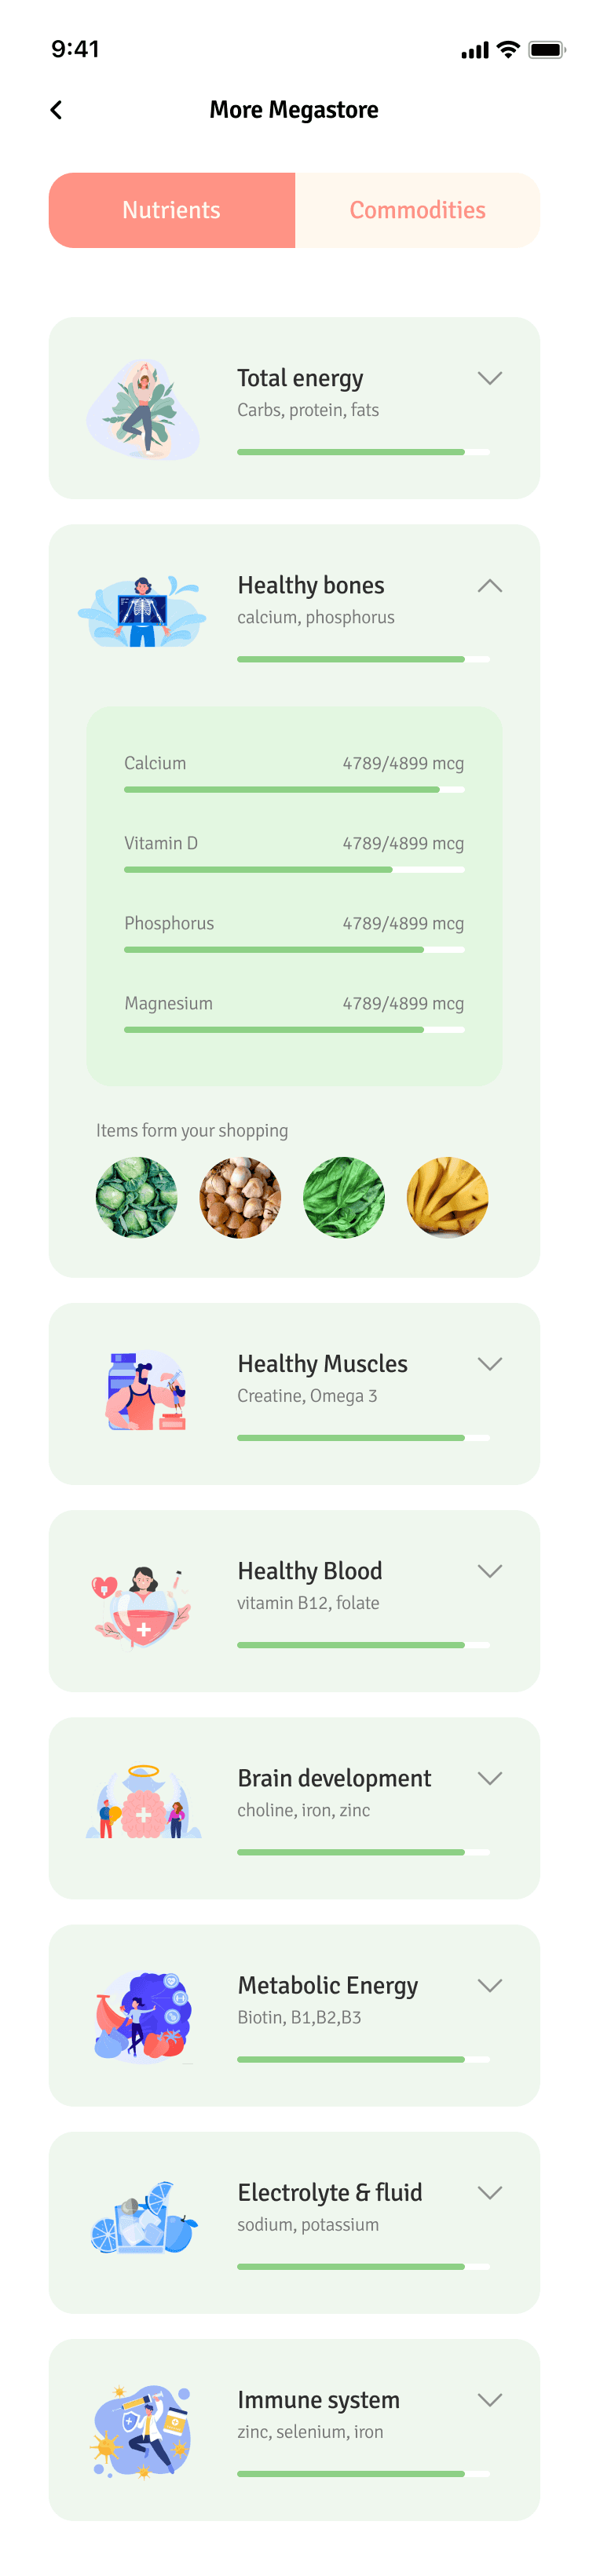
She can now check all the nutrients that are fulfilled under each categories.
The categories are divided into, Total energy, Healthy bones, Healthy muscles, Healthy blood, brain development, Metabolic energy


She can tap into a nutrient section, eg: Healthy bones, and see all the calcium and vitamins that she will get form groceries she shopped.
Eg: In healthy bone section while looking at the nutrients she got she is also shown the items from her shopping which will give her these nutrients
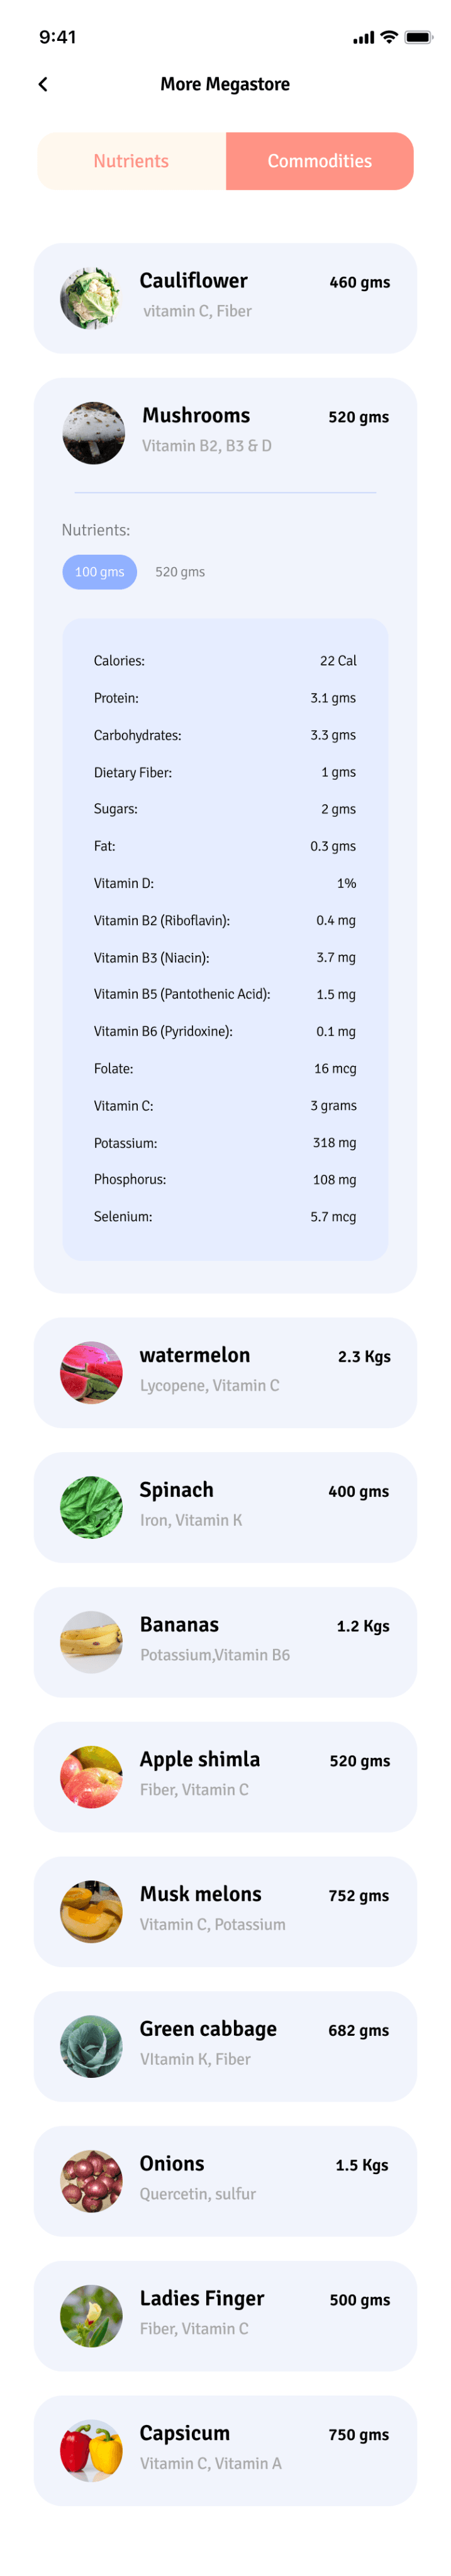
By tapping on commodities tab, stacy can view all the groceries, vegetable items that she has shopped and the nutrients that will provide to the family for healthy living.
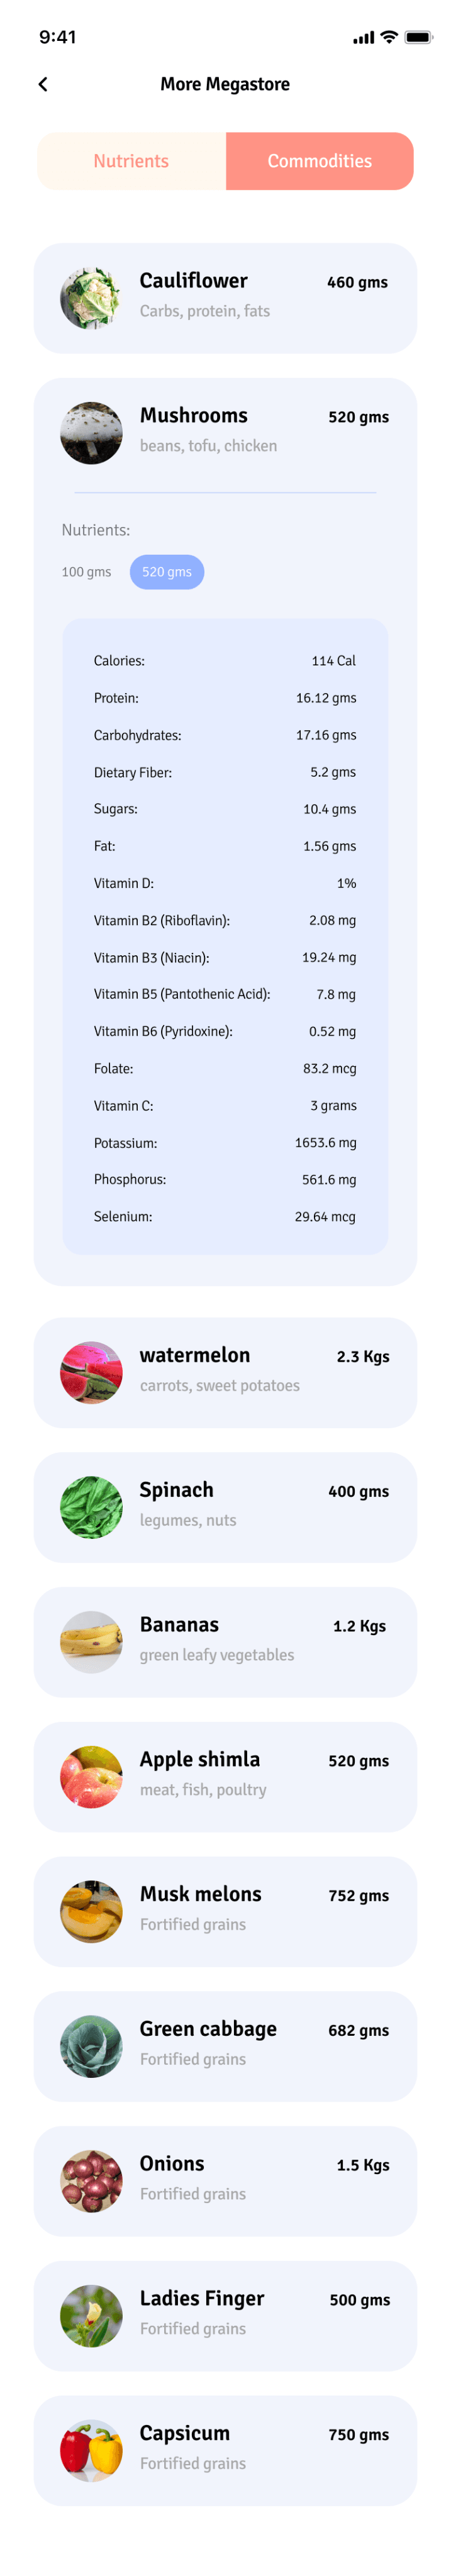
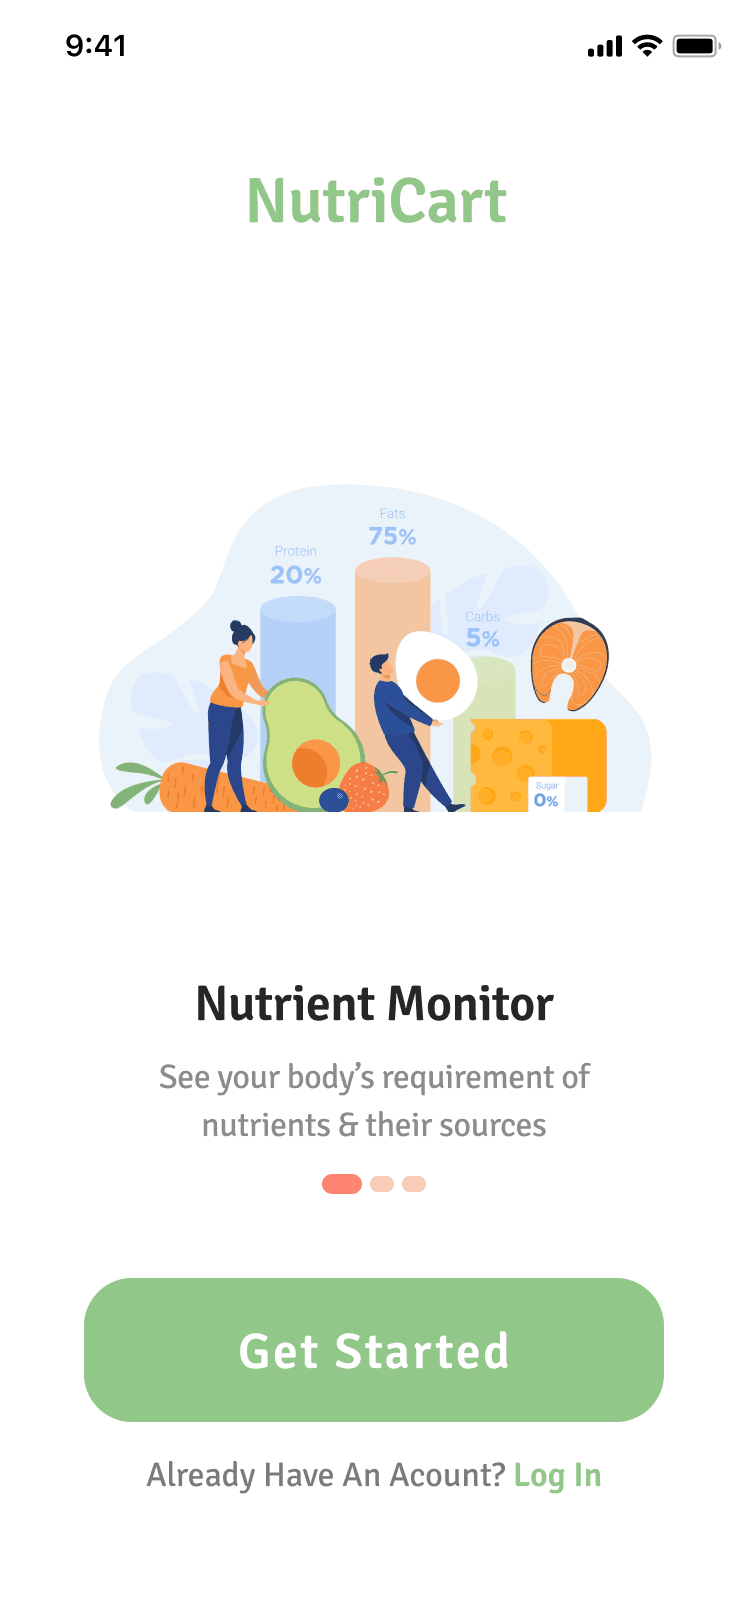
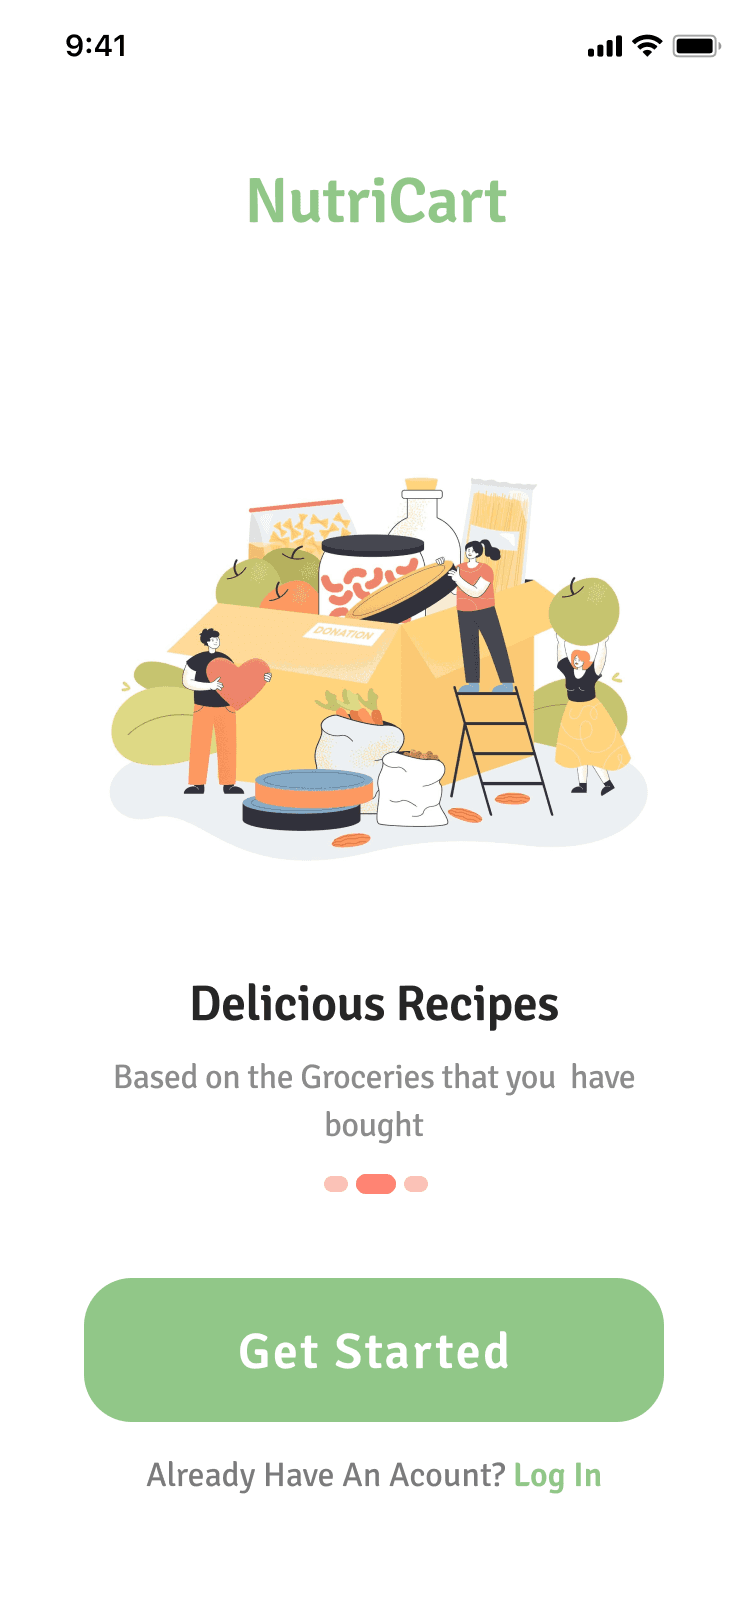
NutriCart
Balanced Nutrition shopping
A unique shopping experience for buying groceries that helps people have a balanced diet from good sources of nutrition. Properly achieves this by providing them recommendations on what to eat based on their physiological conditions
Company
Studio Project
Role
UX Research
UI & UX Design
Industries
Groceries & food
Date
Jan 2022
About NutriCart?
Heading for grocery shopping & uncertain if it fulfills your daily nutritional needs?
Nutrichart assists you in making informed decisions about the nutritional value of groceries as you shop at any local or major convenience store.
Grocery recommendations based on individual physiological conditions.
Sugar & Processed foods
Indians also tend to eat much more sugar and processed food than what is recommended, even when they have the money to eat more diversified diets.
Whole grains refer to rice, wheat and wheat products, millets and their products;
Cereal products refer to maida and other refined products from cereals;
Palm oil refers to vanaspati; unsaturated oils refer to sunflower, groundnut
Refined vegetable oils; dairy fats refer to ghee and butter.
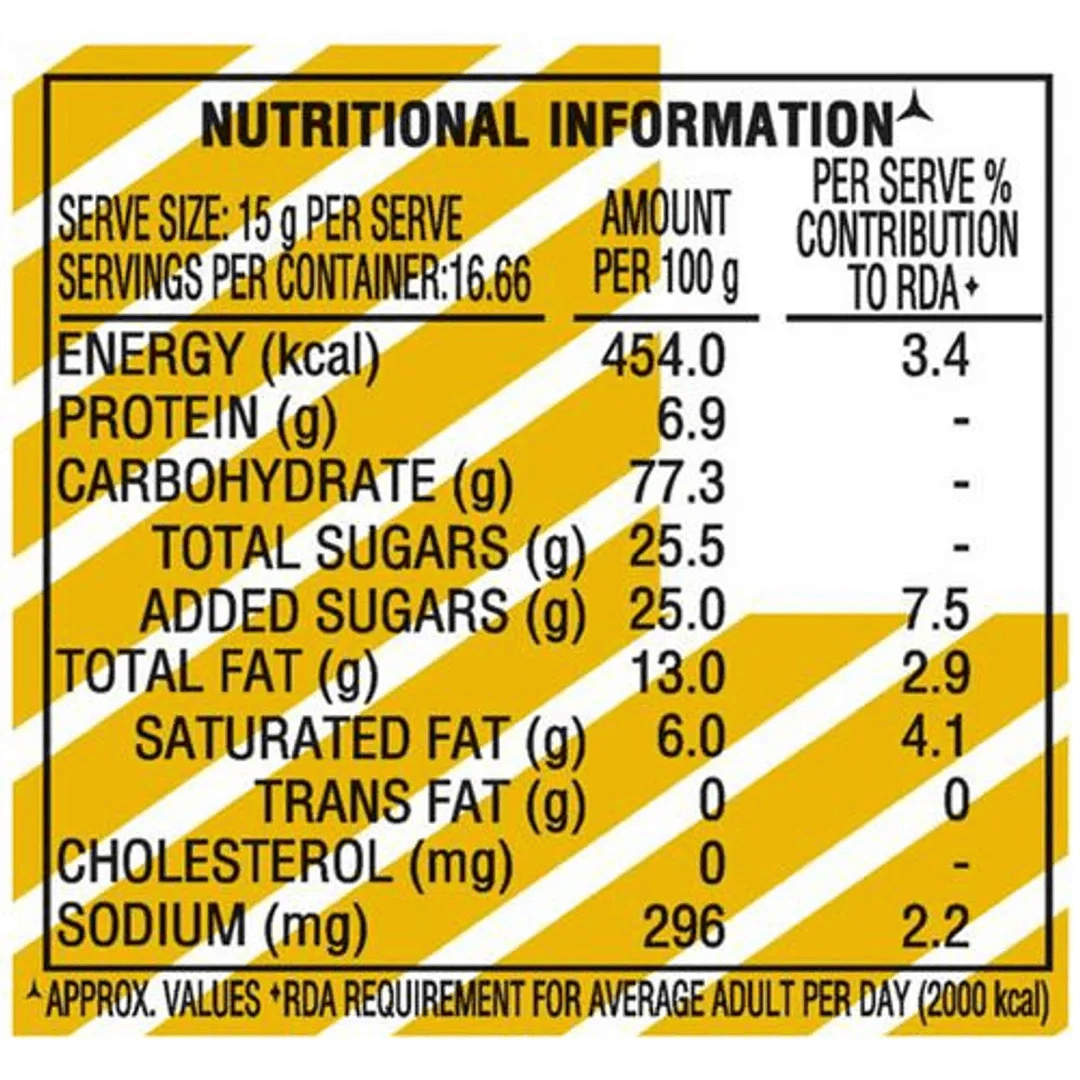
When I searched for RDA information on food items we eat...
I found that:
There is irregularities in serving size of similar commodities
Similar commodities have different nutritional chart
No nutritional information available for fresh fruits, vegatables and unpackaged grains.
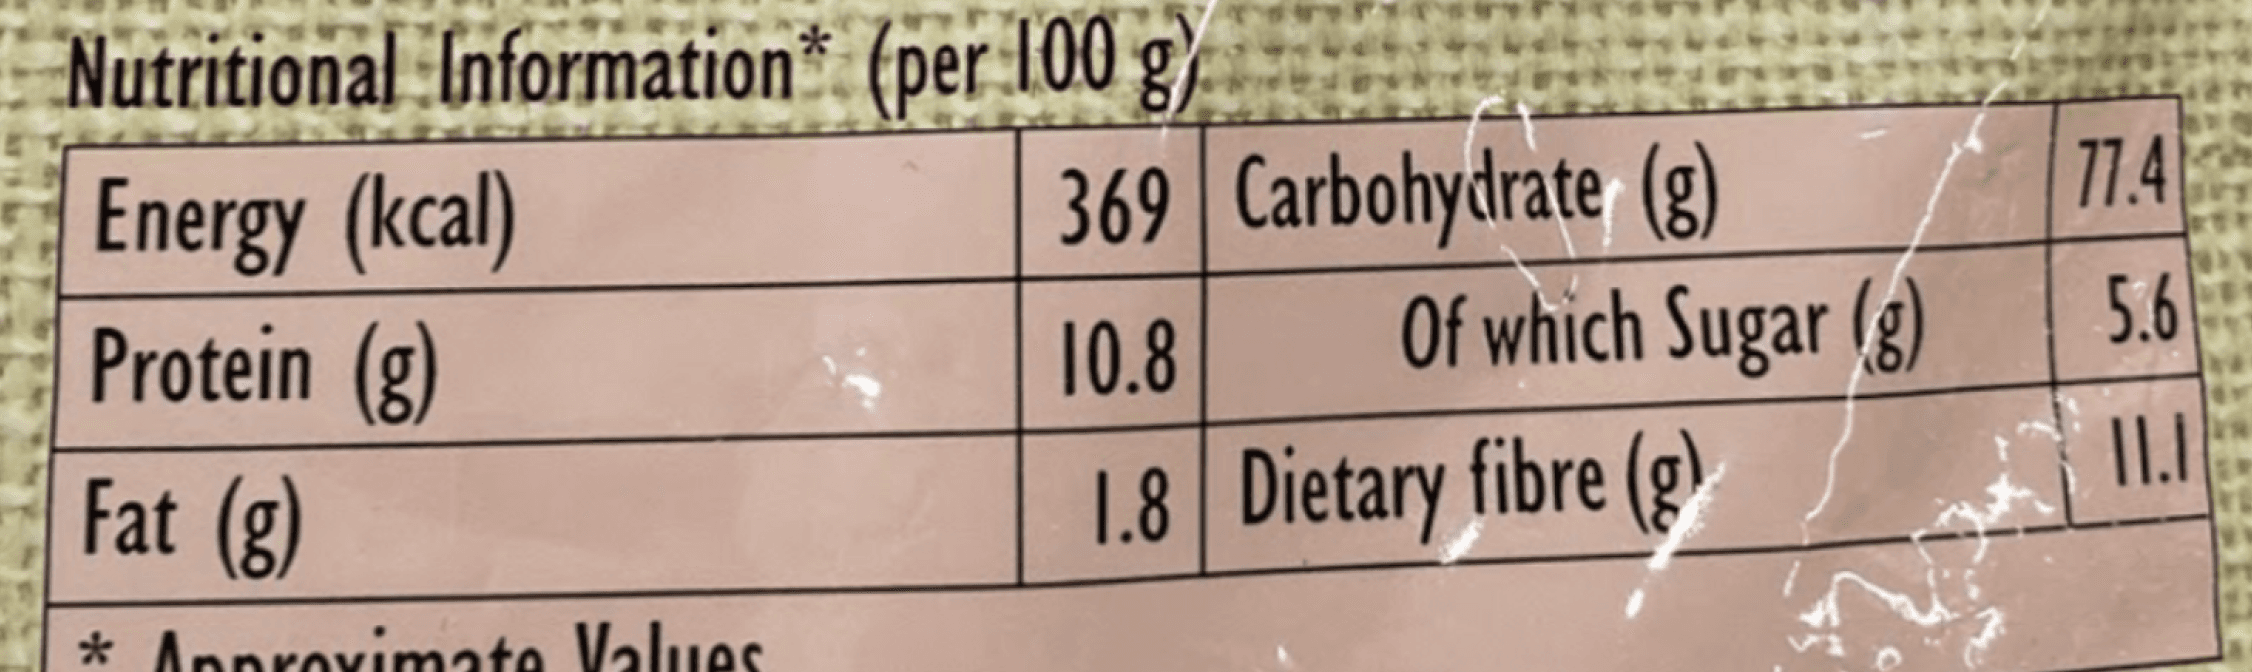

Different nutritional value in two wheat flour brand
Energy - 369/364
Protein - 10.8/12.3
Fat - 1.8/2.2
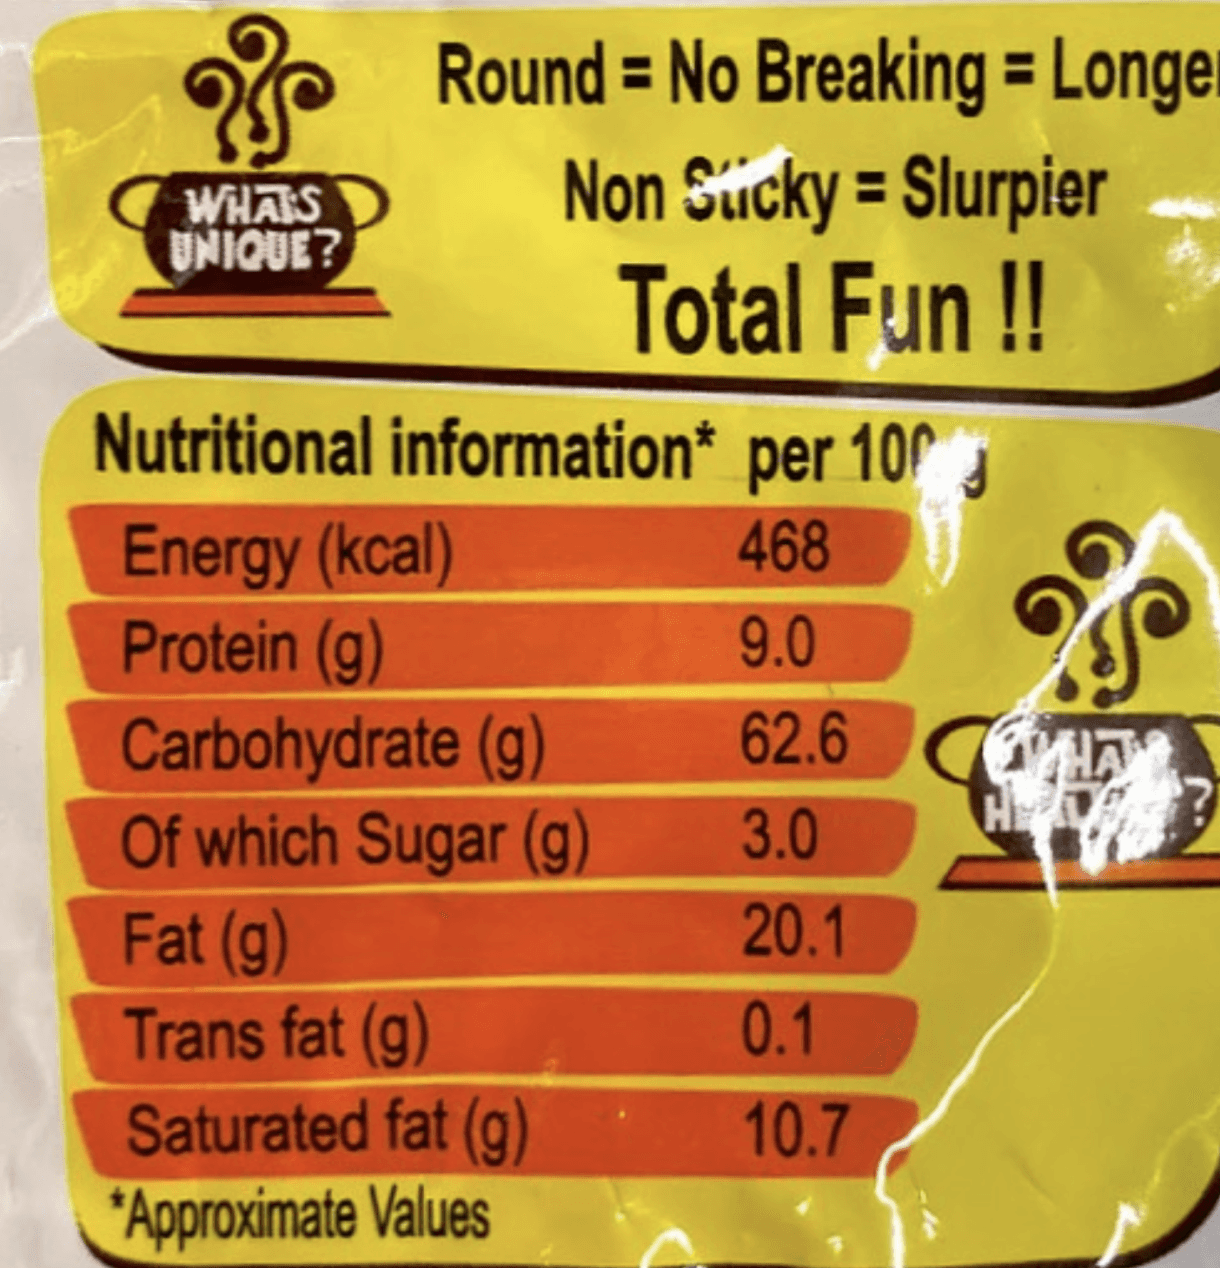
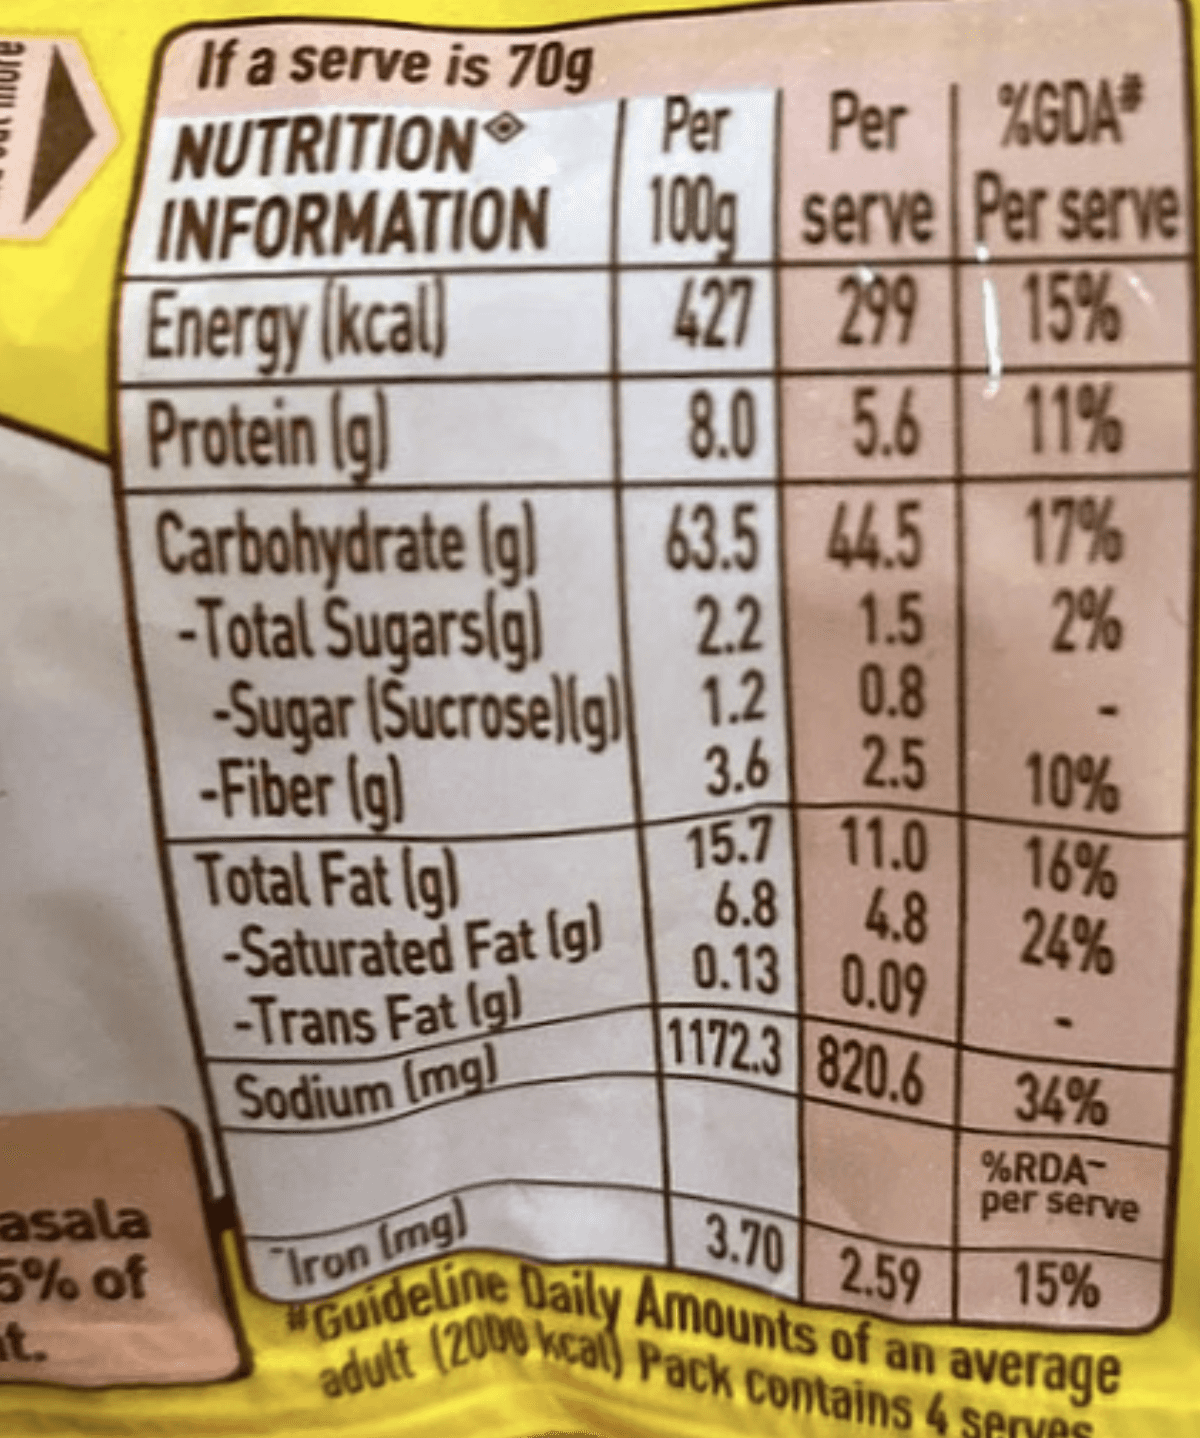
Different serving sizes in popular Noodles brand
Per 100g
Per serve
% GDA per serve
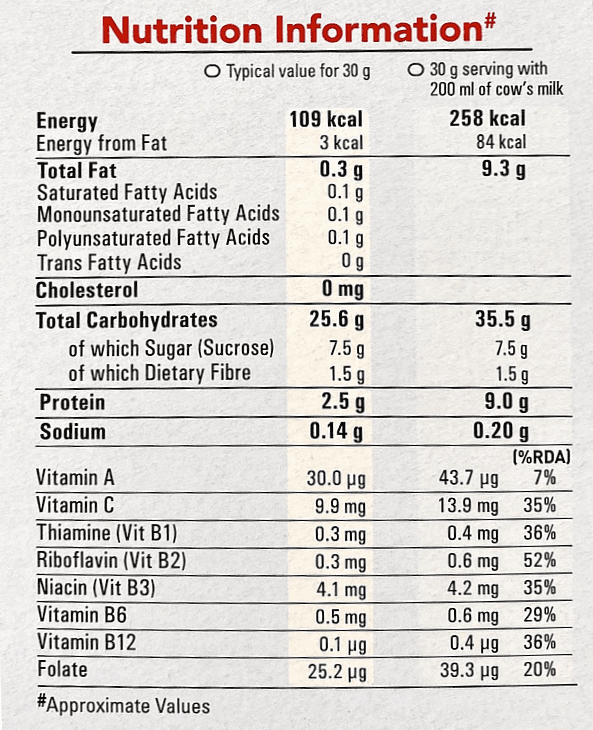
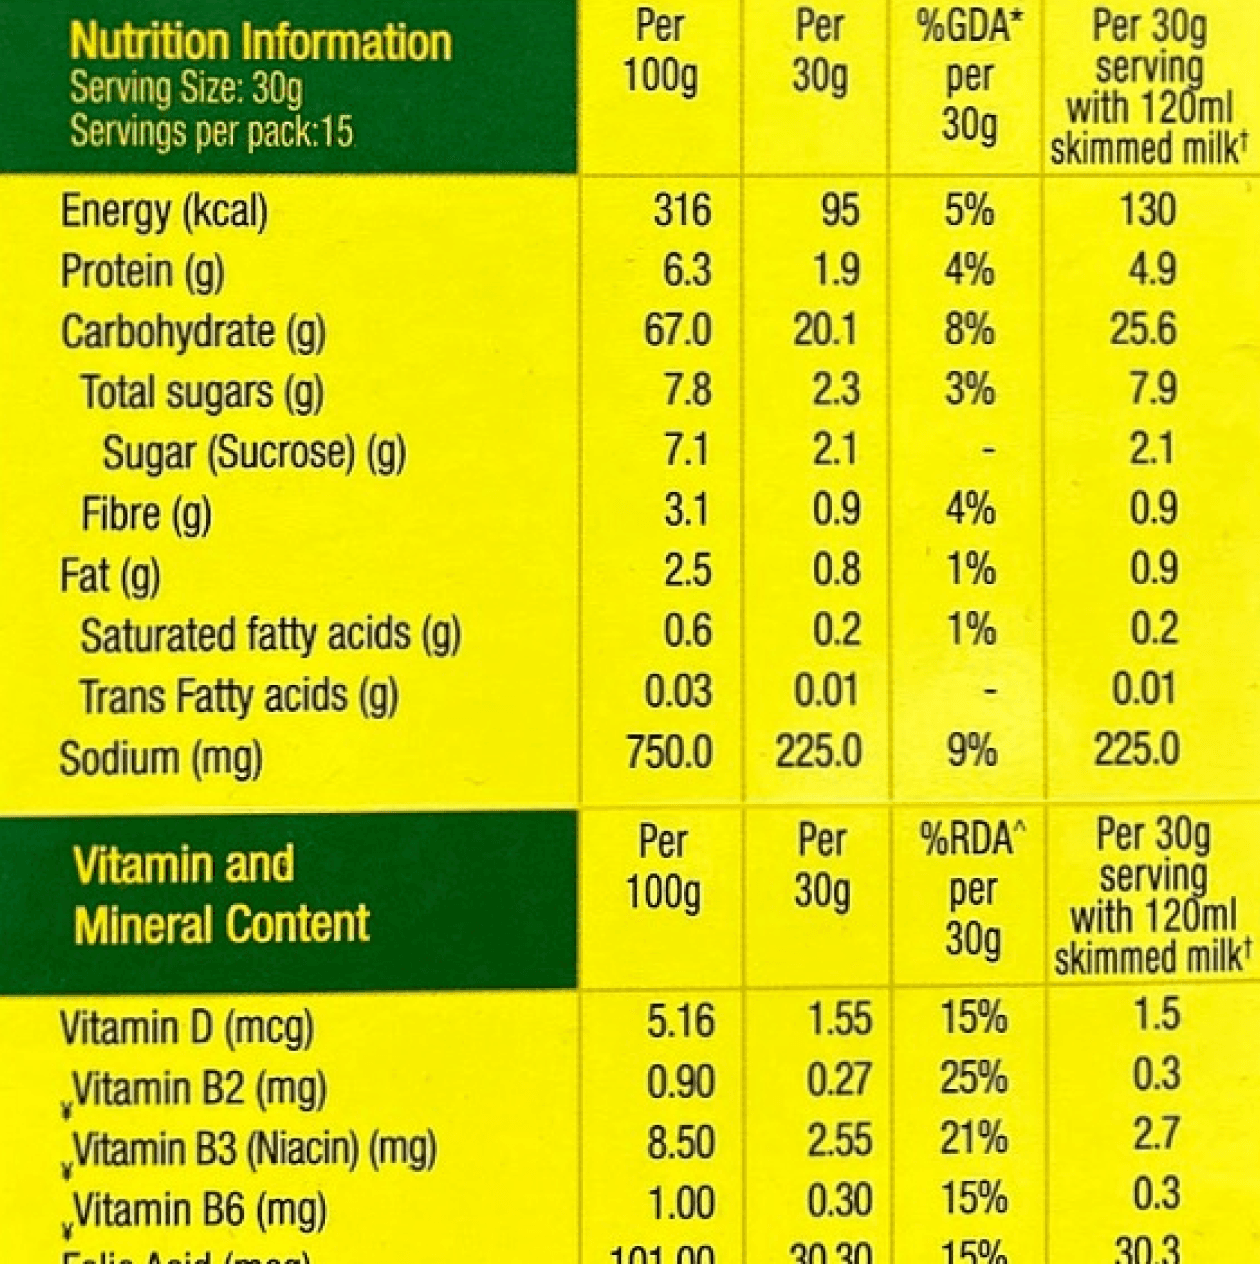
Comparison between 2 cornflakes brands that advertise themselves as healthy:
Brand 1: 30g serving with 200 ml of cow's milk.
Brand 2: 30g serving with 120ml skimmed milk